
Setting the right price for a product is a crucial part of business success. No amount of product research, shiny packaging, or social media posts will persuade consumers to buy your brand if the price isn't right.
Finding the optimal price at any given moment in a product's life will drive sales as well as have a positive effect on brand perception. The question is, how do you establish what the right price is?
Below are our top three price analysis methods.
1. van Westendorp Price Sensitivity Meter (PSM)
Market research departments like to use this method quite often since it can be implemented cheaply and easily. The “van Westendorp” approach belongs to the group of direct but unaided pricing surveys (which means the prices aren’t specified). These four questions are asked:
- Which price do you consider cheap for this product?
- Which price do you consider expensive for this product but still just acceptable?
- Which price do you consider too expensive for this product?
- Which price do you consider too cheap for this product so that you would actually question the quality?
Using a tool that quantilope offers as a module, you can generate six price curves from all of the respondents’ answers to these four questions. The curves for “cheap” and “expensive” are also shown in an inverted form. The intersections of the six curves indicate the optimal price of the evaluated product:
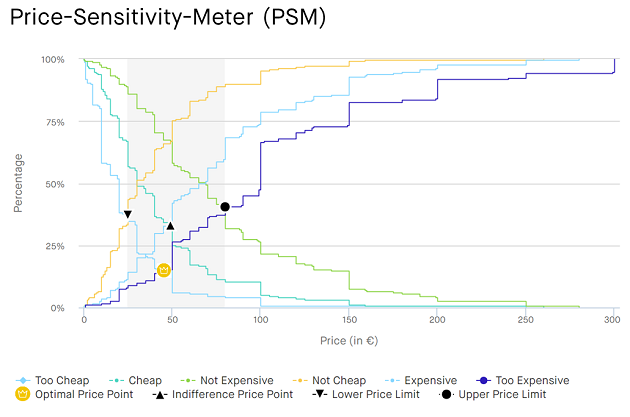
The intersection of “too cheap” and “too expensive” is considered the “optimal price point”. At this level, the same amount of respondents consider the price to be unacceptable (in the positive as well as negative sense). According to the PSM theory, this point is where to expect the lowest buying resistance based on the price. The PSM also provides other analysis results: To find a price range, the span between the intersection of “too cheap” vs. “not cheap (cheap inverted)” (lower price limit) and the intersection of “too expensive” and “not expensive” (expensive inverted) can be considered a potentially suitable price level from the consumer's perspective. The so-called indifference price (intersection of “cheap” and “expensive”) as another possible price acceptance point is also generally within this range. The indifference price is also often referred to as the expected normal price of the product or service category.
A Van Westendorp works well for:
- lower-priced products (e.g. fast-moving consumer goods)
- products which the respondents can easily picture (products whose properties almost everyone knows)
- products with a broad target group (products that would be considered or needed by many people)
A Van Westendorp doesn’t work as well for:
- more expensive products (e.g. expensive audio products)
- products which many respondents would still find difficult to grasp / imagine, maybe due to their novelty or uniqueness.
- products with a very focused target group (for a Ferrari, the PSM only makes sense if you only consider respondents who are very receptive to expensive sports cars, namely sports car enthusiasts)
In many practical cases, however, it’s possible to prevent the weak point when applying the PSM for new or different products. To aid respondents in classifying the new product and its price range, it can be presented in a competitive environment, for example, on a shelf with competing products. The respondents can then place the product into a category, which results in more realistic assessments during the unaided price inquiry of the PSM. One of the pitfalls with the PSM is that the question of who was surveyed becomes crucial in the evaluation. During the analysis, the respondents often have to be filtered to really consider only those “highly receptive” to the product in the price curves. This helps prevent distortion of the determined prices by those who reject the product.
The intriguing question is: At which level is the product interest high enough for someone to be considered in the PSM? And when shouldn’t you consider that person? Depending on where you set the limit, you will get different results, since the product interest and the willingness to buy and/or pay are generally correlated with each other to a high degree. In real-life situations, the Top2 box is often used in surveying the buying interest in order to split the sample into those who are “interested” and “not interested”. This type of sensitivity analysis should be performed with automated tools during every application of the PSM to test the robustness of the derived price recommendation.
With every price recommendation based on the PSM, it is important to keep in mind that the surveys are focused almost exclusively on the price. No other product features are included and the competitive environment isn’t considered at all. Nonetheless, especially when combined with other procedures, the “van Westendorp” can be a practical and easy-to-understand method to find out about value-based pricing (or the target group’s willingness to pay).
2. Gabor Granger Method
This technique is also one of the direct but aided price surveys (i.e. the prices are specified). It is primarily used to find out whether the price of existing products can be raised without reducing the product sales (too) much. This is how to proceed:
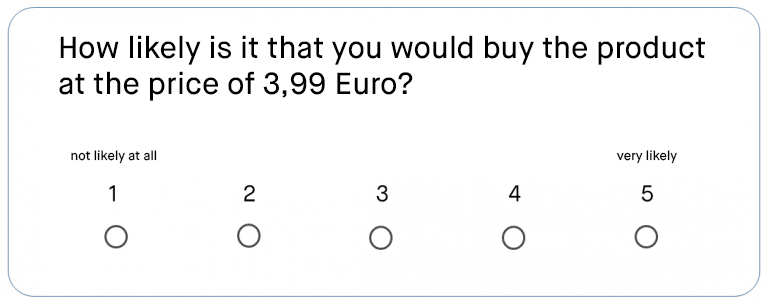
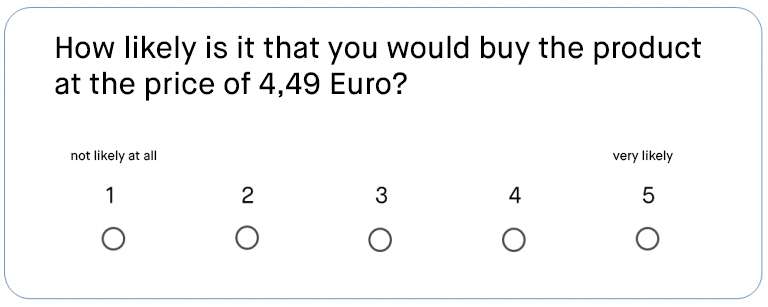
...and so on.
It is recommended to use three to five price levels and price changes in the same intervals. Using the percentages from all of the respondents’ scaled answers, it is easy to create a price/sale function that shows which price points constitute thresholds that disproportionately raise or lower the willingness to pay. As with the “van Westendorp” method, the price sensitivity is highly contingent on the product and the competitors’ activities in the relevant market.
The basic version of the Gabor Granger method doesn’t take effects from competitors into consideration, but those should definitely be determined in an appropriate pricing study and included in the analyses. In contrast to the PSM, however, the price anchor effects shown by the Gabor Granger method are intrinsic to the system, since the respondents are guided by the specified prices. Another aspect is that only a certain price range can be surveyed in the aided price inquiry.
3. Choice-Based Conjoint
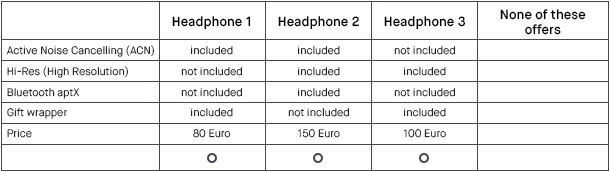
The choice-based conjoint (CBC) is the most “elegant” technique in pricing research. Various product attributes (of which price is just one, even if it’s very important) are combined into a “complete product” and presented to respondents in a fairly realistic selection process. With the CBC, which can be conveniently created and visually evaluated with a module by quantilope, for example, the respondents are asked which of several products they would choose in a buying situation. They are asked to select a product or click on “I wouldn’t choose any of the products”:
The respondents complete these tasks more than once. They move through similarly structured screens about 10 to 15 times. Ideally, if possible, the combinations of the product characteristics are shown in arbitrary combinations to yield as much information as possible; this is referred to as efficient design.
It’s possible to customize the design with restrictions (e.g. that products with very elaborate features may not be presented at a very cheap price). However, this limits the statistical quality of the conjoint design, so only real experts should do this. With the combined presentations of the product evaluations, the benefits contributed by the individual product features (as well as the price!) are measured indirectly. This is actually a smart trick since the respondents aren’t asked directly about the influence of individual price points, product features, etc. Instead, the benefits contributed by the features are determined statistically through the “back door”, for example through hierarchical Bayes estimates.
With these benefit contributions – also referred to as partial utility values of the individual product features – it is now possible to calculate each respondent’s likelihood of purchasing one’s own as well as any competing products. Furthermore, in the scope of virtual market simulations, you can precisely quantify how much the individual product features contribute to the likelihood of the purchase and the willingness to pay. In a fictitious example, let’s say that respondents consider headphones with Bluetooth aptX to be worth 20 Euros more than those without this feature.
A particularly valuable aspect of the CBC method is the possibility to perform all analyses with the inclusion of the competition. In this area, the choice-based conjoint greatly surpasses such methods as the Price Sensitivity Meter and Gabor Granger method. A choice-based conjoint is something like the “gold standard” among the price determination techniques – it’s an indirect process that doesn’t just ask respondents how much a certain product feature is worth to them.
Possible applications and benefits of a choice-based conjoint analysis, at a glance:
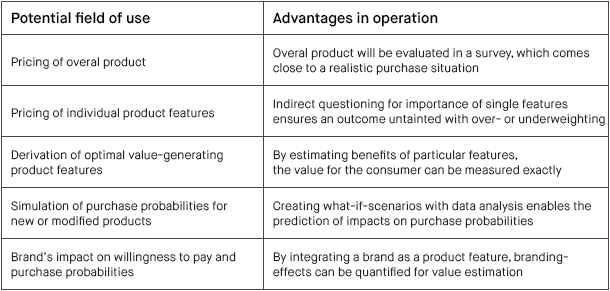
When using a CBC, it’s crucial to set up the conjoint design very carefully and, above all, explain the product features so well in the survey that the consumers experience no difficulty in understanding them. Features that only vaguely come to the respondents’ minds when they make a decision will result in massive inaccuracies and, in the worst case, can make the results unusable. A precise and easily understood explanation of what we mean as researchers is thus the be-all and end-all in a conjoint (as much as in all price determination techniques).
Conclusion
The applications, as well as the advantages and disadvantages of the three outlined methods, are obviously very heterogeneous:
- The van Westendorp Price Sensitivity Meter (PSM) excels with its ease of use and the mostly standardized analysis. The method has weaknesses especially with more expensive products, very innovative offers, and focused target groups as well as with products in highly competitive markets.
- The Gabor Granger Method also offers a fast and easy application. By integrating the relevant scale questions, you can determine information about the consumers’ price sensitivity without great effort. However, this technique is generally limited to price increase scenarios for existing products that the respondents already know. It does not consider the competitive environment and no prices are specified (price anchor effect).
- The Choice-Based Conjoint is the most sophisticated but also most complex and elaborate version. A great advantage is that price acceptance is measured indirectly. Additionally, the price levels can be carefully coordinated in relation to the characteristics of other product features (e.g. material, workmanship, feature integration, etc.). As a result, it is possible to gain insights about numerous other product features in addition to the price.
Pricing strategy usually sets the appropriate course for the future of a product or even a company. Considering how important such decisions are, several of the outlined methods should be used in combination if possible.
For example, you can expediently confirm the price acceptance indications gained with a choice-based conjoint by also integrating a van Westendorp Price Sensitivity Meter in the questionnaire before the conjoint module. Combining the outlined methods is the best way to get truly professional results about prices in your market research. This increases the quality of your pricing insights and sales forecasts considerably.
Your in-house clients will thank you.