
quantilope's syndicated Better Brand Health Tracker in the soda category is the first to leverage the new BBHT model within the Consumer Intelligence Platform.
As noted above in a screenshot sneak-peek of the study's dashboard, quantilope's new approach to tracking swaps out basic brand funnel metrics for empirically-grounded market research concepts known as Category Entry Points (CEPs) and Mental Availability. These two concepts come from the acclaimed work of Professor Jenni Romaniuk of the Ehrenberg-Bass Institute for Marketing Science (author of Better Brand Health and co-author of How Brands Grow).
CEPs are the 'cues' that prompt consumers to think about certain buying scenarios, and Mental Availability is when consumers think of your brand in those situations. For example, if someone is packing for a vacation, that's a 'cue' to go out and buy sunscreen. So the Category Entry Point would be 'going on a summer trip'. When a consumer is packing their bags and thinks to go and buy Banana Boat sunscreen, that shows strong Mental Availability for the Banana Boat brand.

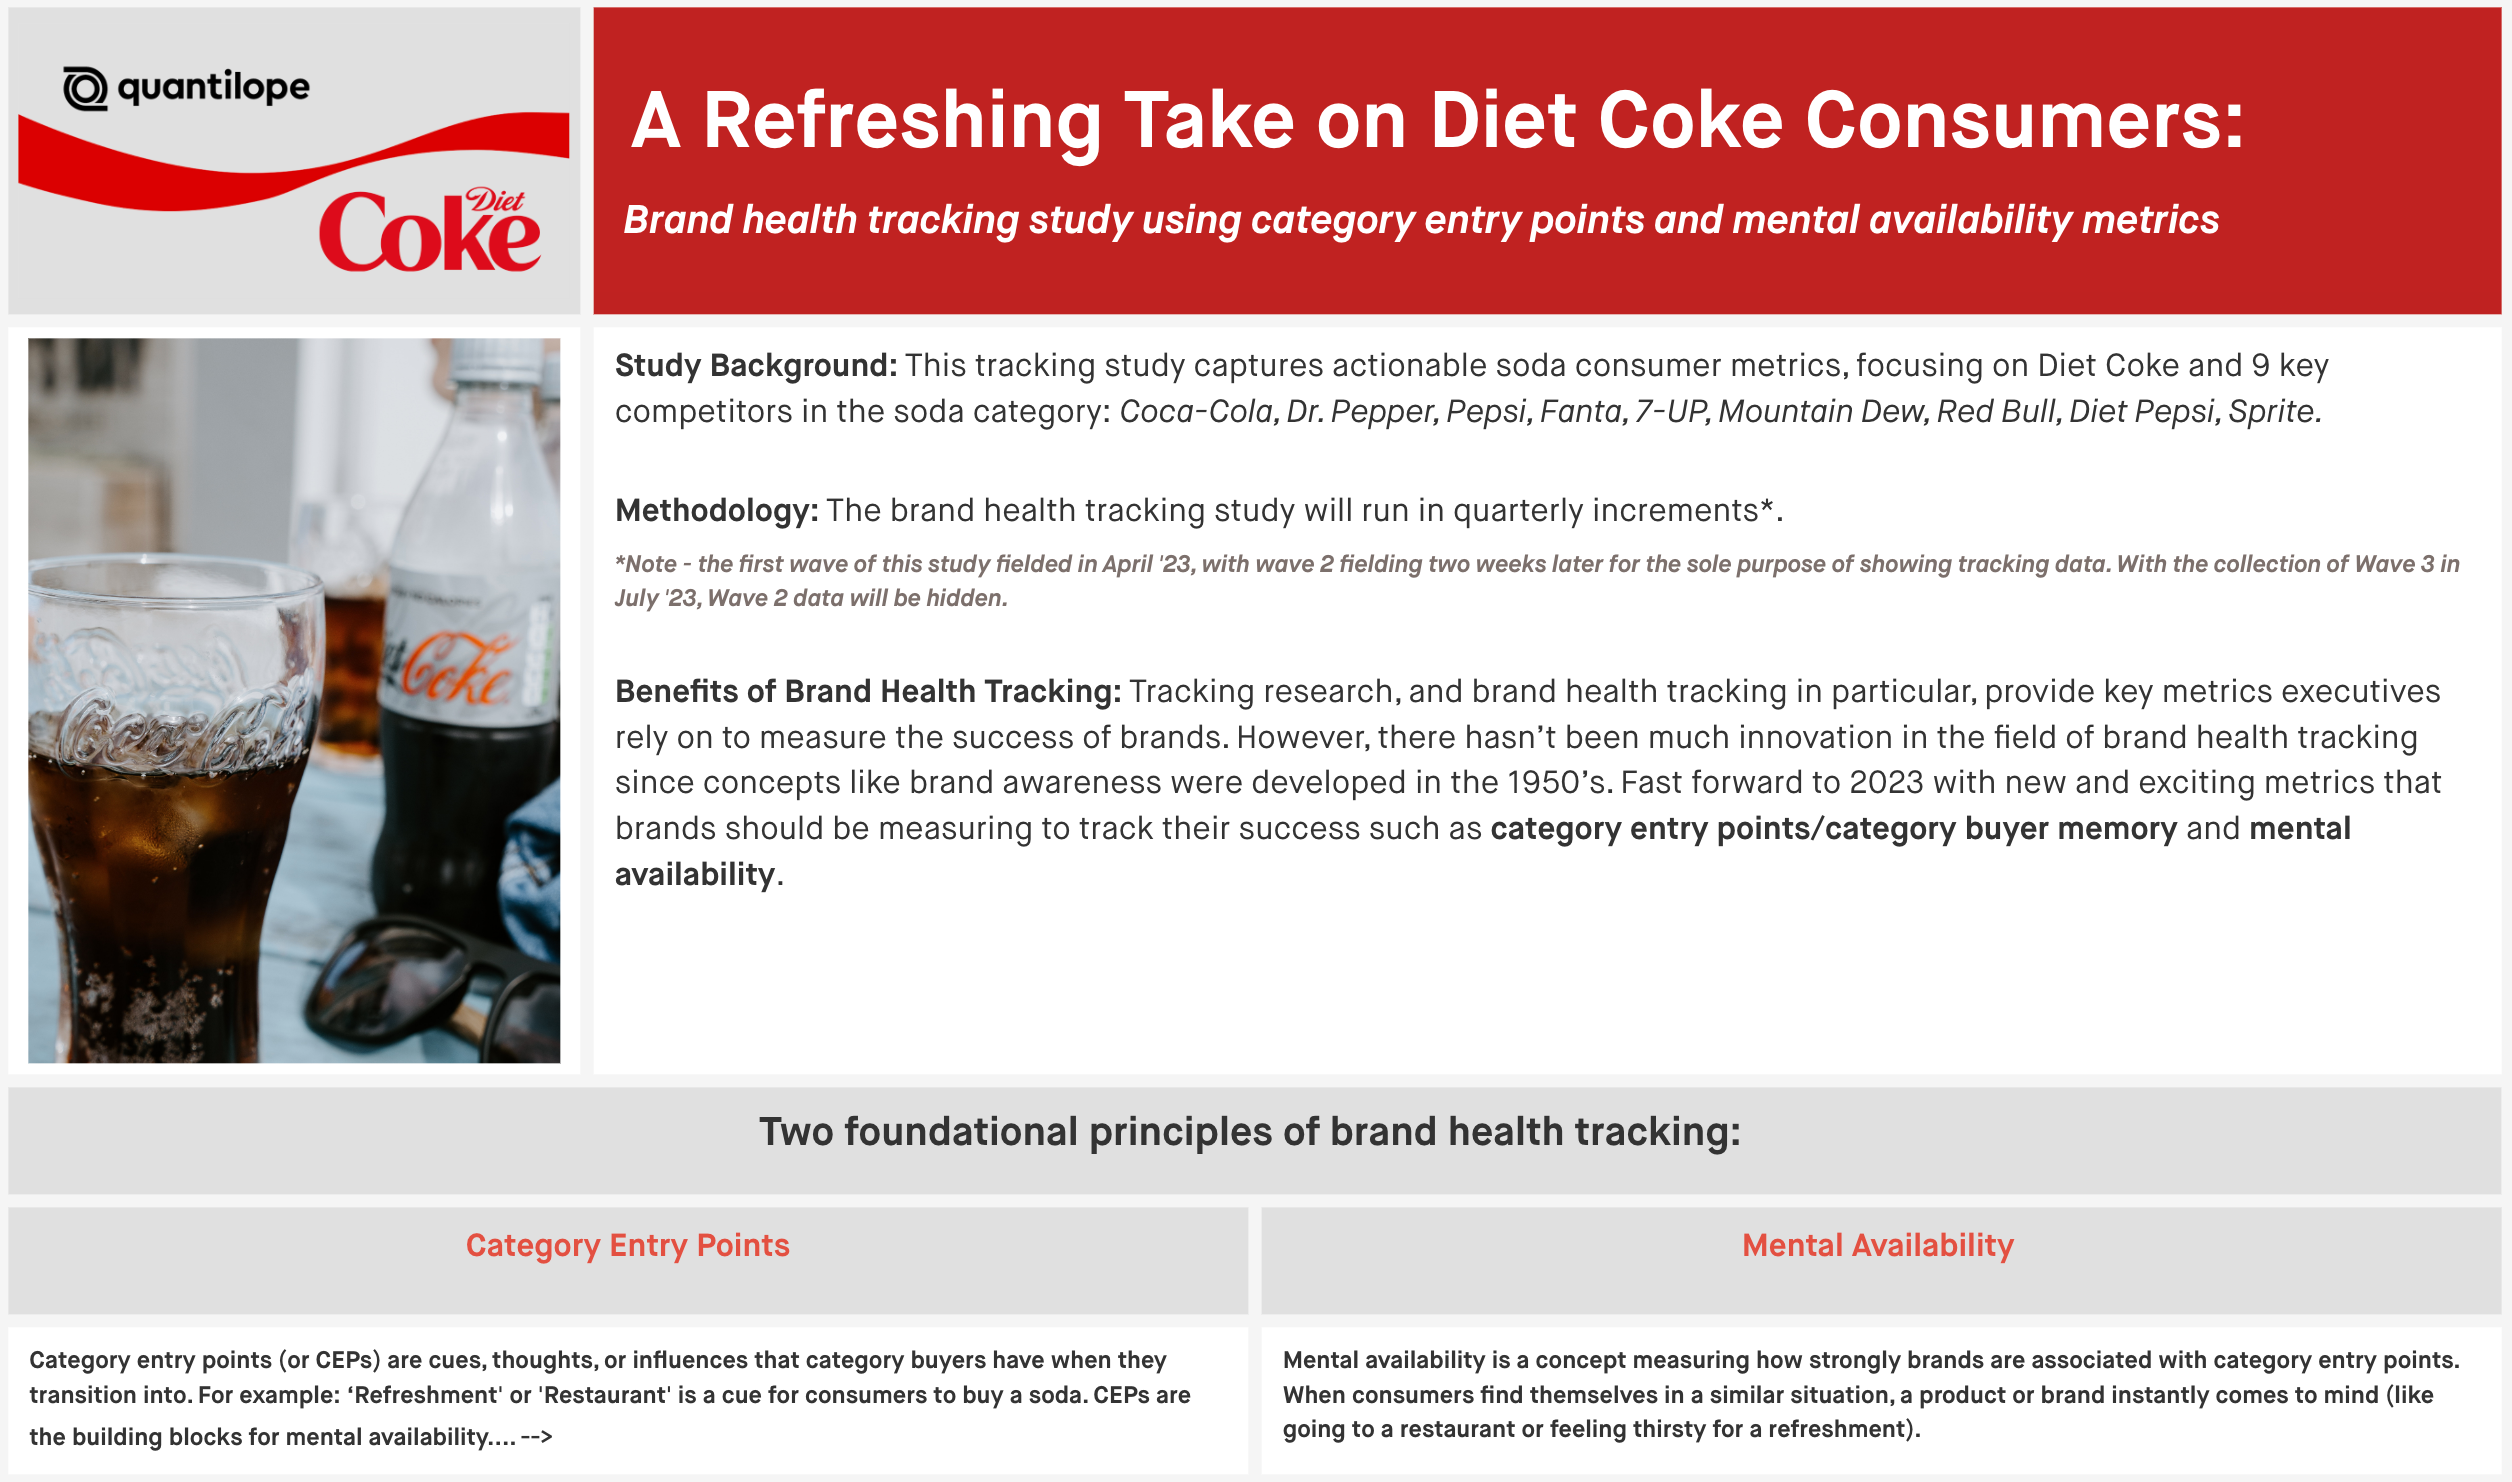
We took this new concept and leveraged it for a refreshing take (pun intended) on soda tracking insights - with a focus on Diet Coke, and 9 other competitive soda brands: Coca-Cola, Dr. Pepper, Pepsi, Fanta, 7-UP, Mountain Dew, Red Bull, Diet Pepsi, and Sprite. Before starting our study, we first needed to establish our CEPs for the soda category using an implicit pre-test. CEPs should be general enough so they could logically apply to any brand in the soda category if another soda company were to run a market research study. The 'pre-study' resulted in a list of 20 potential soda buying 'cues' such as 'refreshment', 'family gathering', 'cravings', 'thirst quenching', and 'restaurant'.
Using these 20 CEPs for soda, respondents were then shown all 10 soda brands and asked to select the brands that fit with each Category Entry Point. From these answers, quantilope's platform automatically calculates four key mental availability metrics known as mental market share, mental penetration, network size, and share of mind.
Below is a quick summary of what each of these four key charts represents:
|
Mental Market Share |
How 'present' a brand is in consumers' minds |
|
Mental Penetration |
Consumers that have at least some mental availability of our brand |
|
Network Size |
How broad category associations are for each brand |
|
Share of Mind |
What other brands are customers thinking of? |
The coolest part about this new model is that (in true quantilope fashion), the entire process is automated from a templated, yet customizable survey set-up, pre-built reporting charts that update in real-time, and a templated dashboard to visualize results for stakeholders.
To explore more Better Brand Health Tracking data for the soda category, including metrics around brand awareness, brand associations, brand attitudes, and more, download the full soda dashboard below!
🔗 Related: What Are Category Entry Points? CEP Guide & Examples


.png)