To put our new Better Brand Health Tracking approach into context, let’s explore our process from start to finish with our soda category BBHT study.
For this study, we put on our 'Diet Coke brand executive' hats and planned a BBHT study from Diet Coke’s perspective. To start, we first needed to define what the Category Entry Points are for the soda category overall. For this step, we used our pre-testing template to understand implicit soda-buying behaviors (i.e. what prompts consumers to buy soda overall - regardless of what brands they’re buying).
The pre-study involved showing respondents a list of soda associations and asking them to choose which associations they felt ‘fit’ with soda products.
As a result, we were left with 20 Category Entry Points to use in our main BBHT study:
- Refreshment
- Restaurant
- Movie/TV evening at home
- Party with friends at home
- Treating myself
- Super Bowl
- Cinema
- Takeout
- Lunch
- Thirst quenching
- Socializing
- Relaxing
- Snack time
- Family gathering
- Cravings
- Dinner
- Picnic
- Enjoyment
- On the go
- BBQ
With this list of CEPs were we ready to start our BBHT by popping these 20 associations into our templated study. We then simply updated the rest of the tracker’s placeholders to reflect the soda category and were ready to go live!

Among questions such as brand frequency, brand recency, brand rejection, and other brand tracking metrics, the CEPs we defined in our pre-study were used to understand associations on a brand level. Respondents were shown a rotating list of these 20 associations and asked which of 10 popular soda brands (Diet Coke and 9 competitors) ‘fit’ with each association.
As shown below, when shown ‘Family Gathering’, respondents will choose ‘Diet Coke’, ‘Coca-Cola’, ‘Pepsi’, ‘Diet Pepsi’, ‘Dr. Pepper’, ‘Fanta’, ‘7-UP’, ‘Mountain Dew’, ‘Red Bull’, or ‘Sprite’, (or a combination of several!). For each association shown, respondents must select at least one brand but are not limited to how many they feel fit that association.

From this question above, quantilope’s automated analysis generates four key metrics related to Mental Availability (which, as you might remember from an earlier BBHT series post, is an advanced method highlighting how (if at all) consumers think about your specific brand in buying scenarios).
|
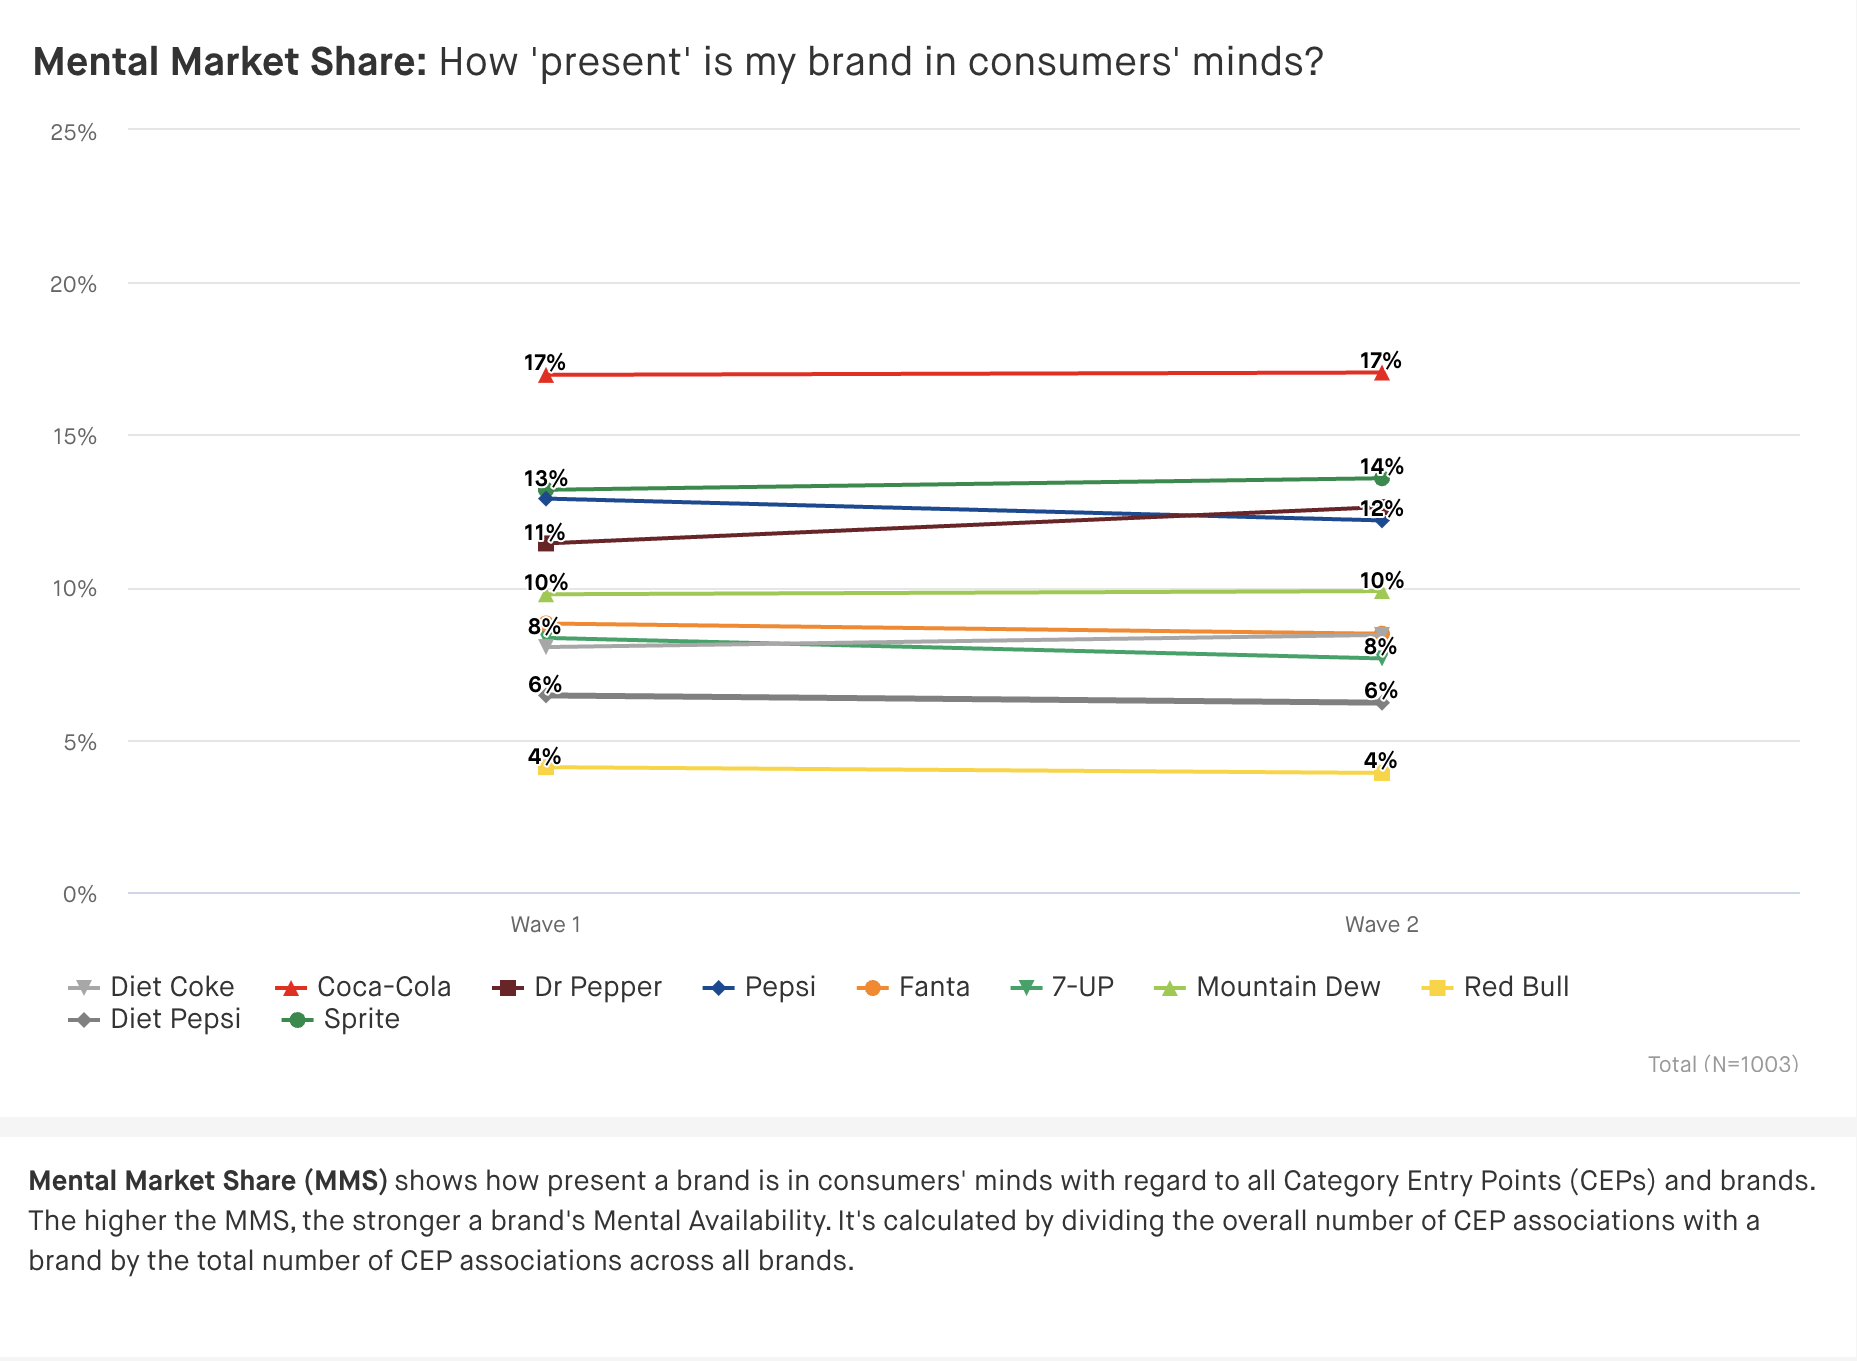
Mental Market Share |
How 'present' a brand is in consumers' minds |
|
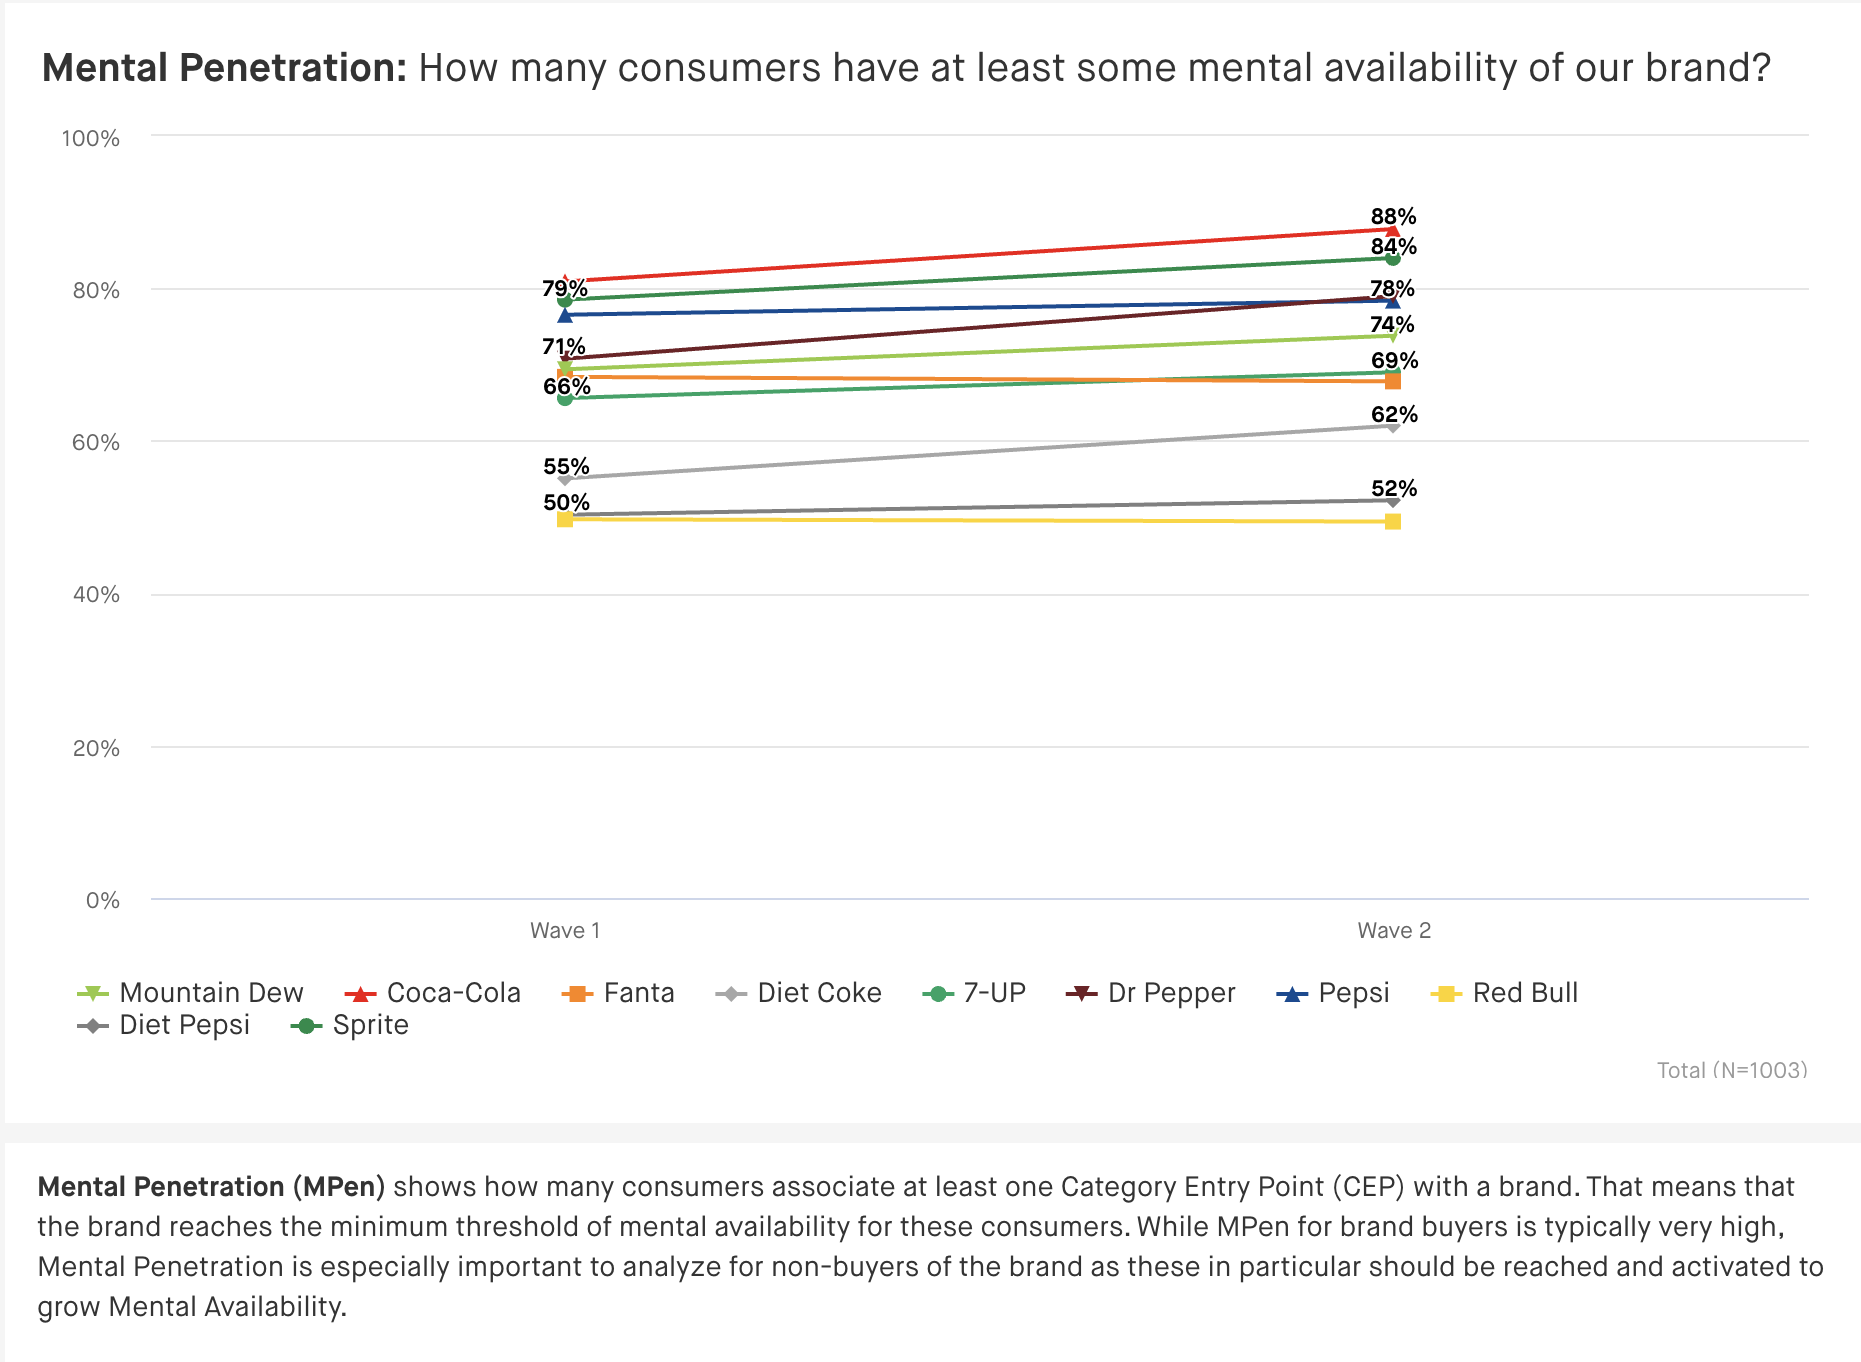
Mental Penetration |
How many consumers have at least some mental availability of a brand |
|
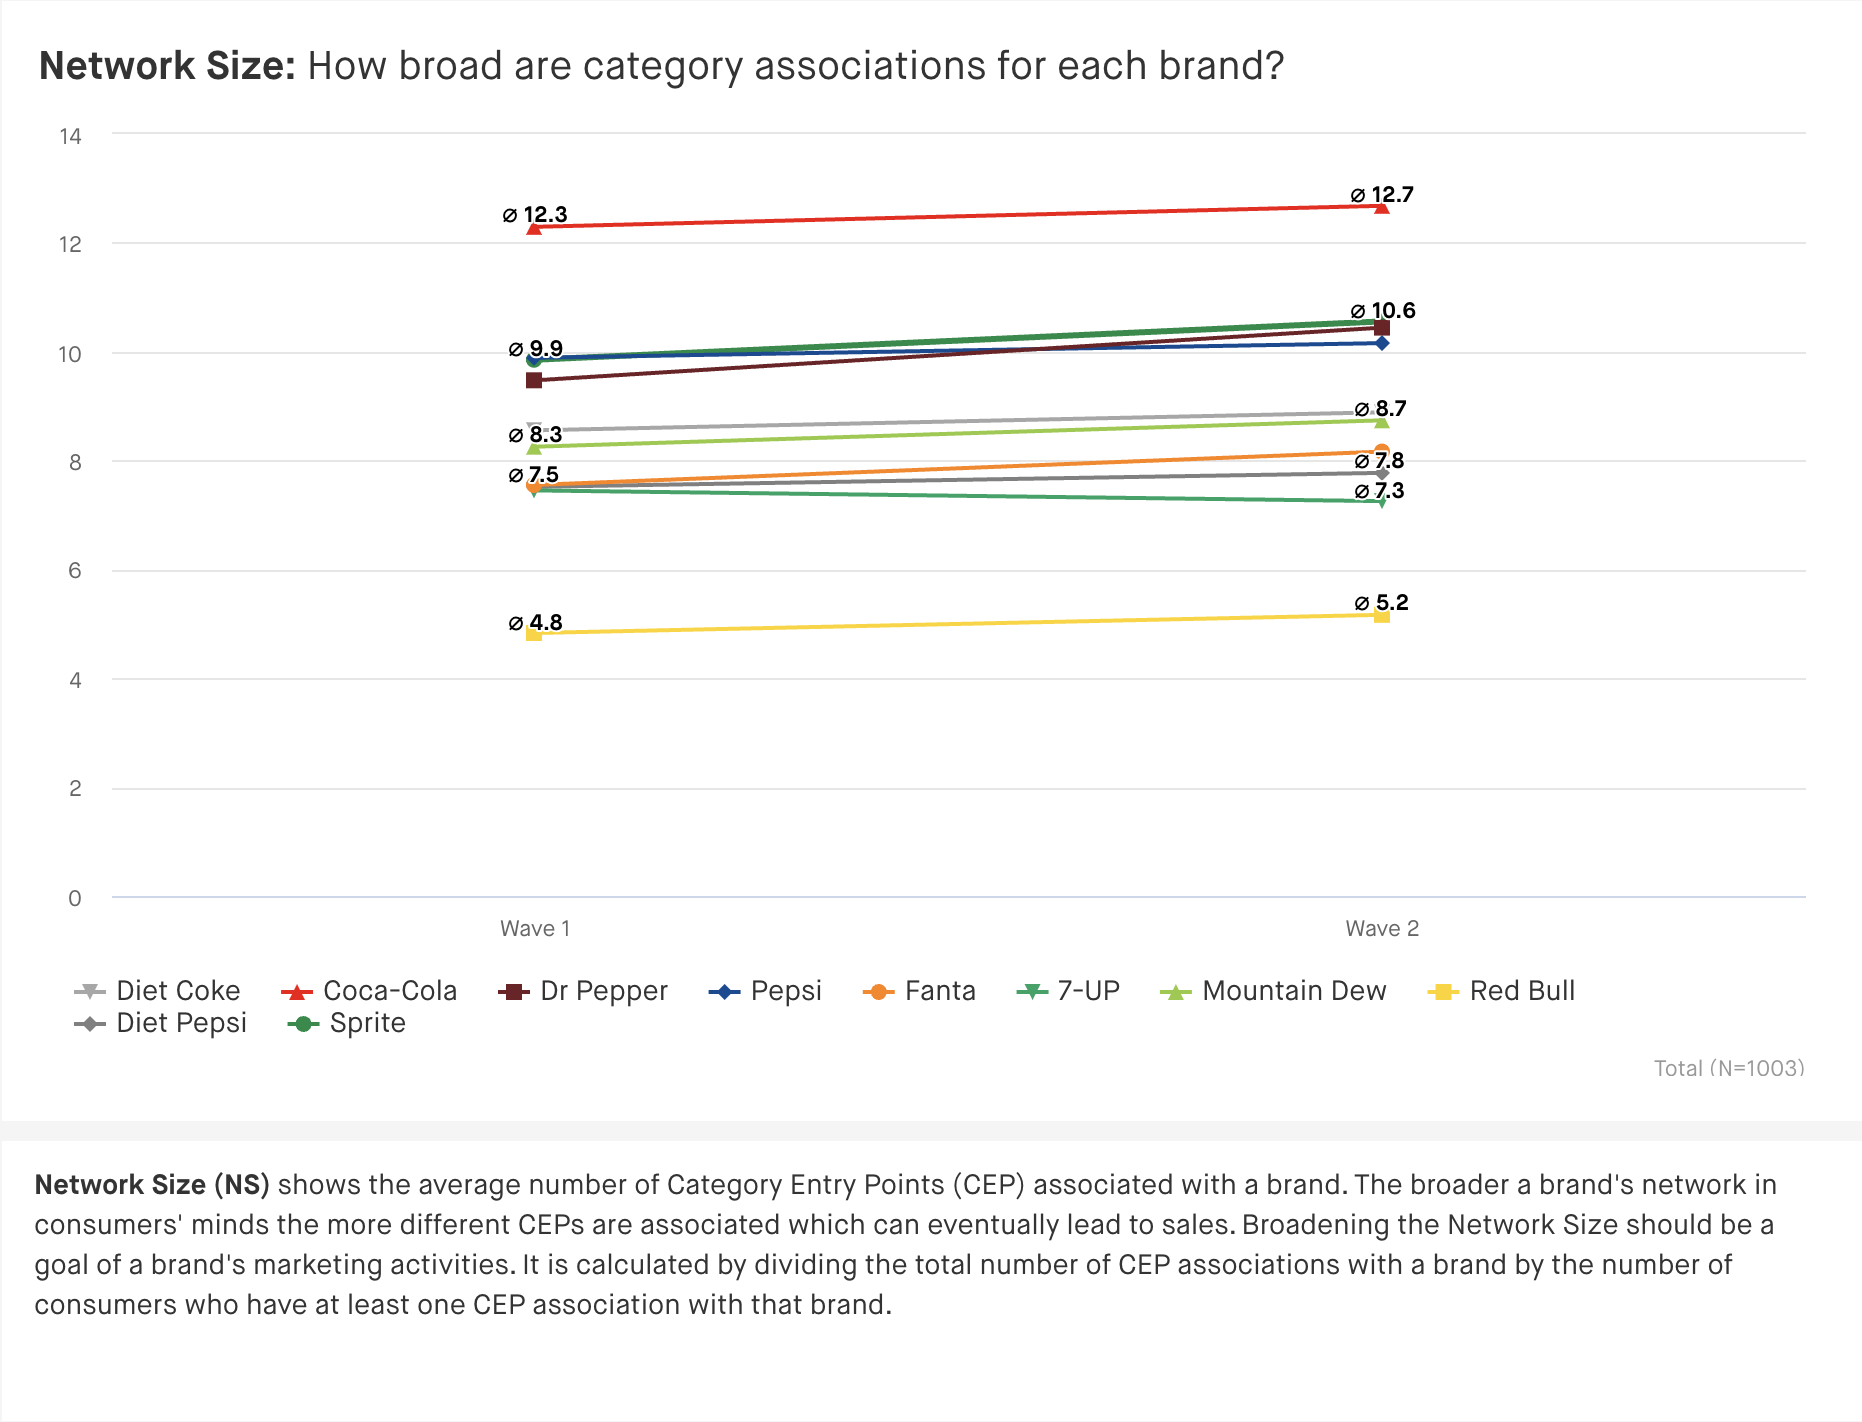
Network Size |
How broad/varied category associations are for each brand |
|
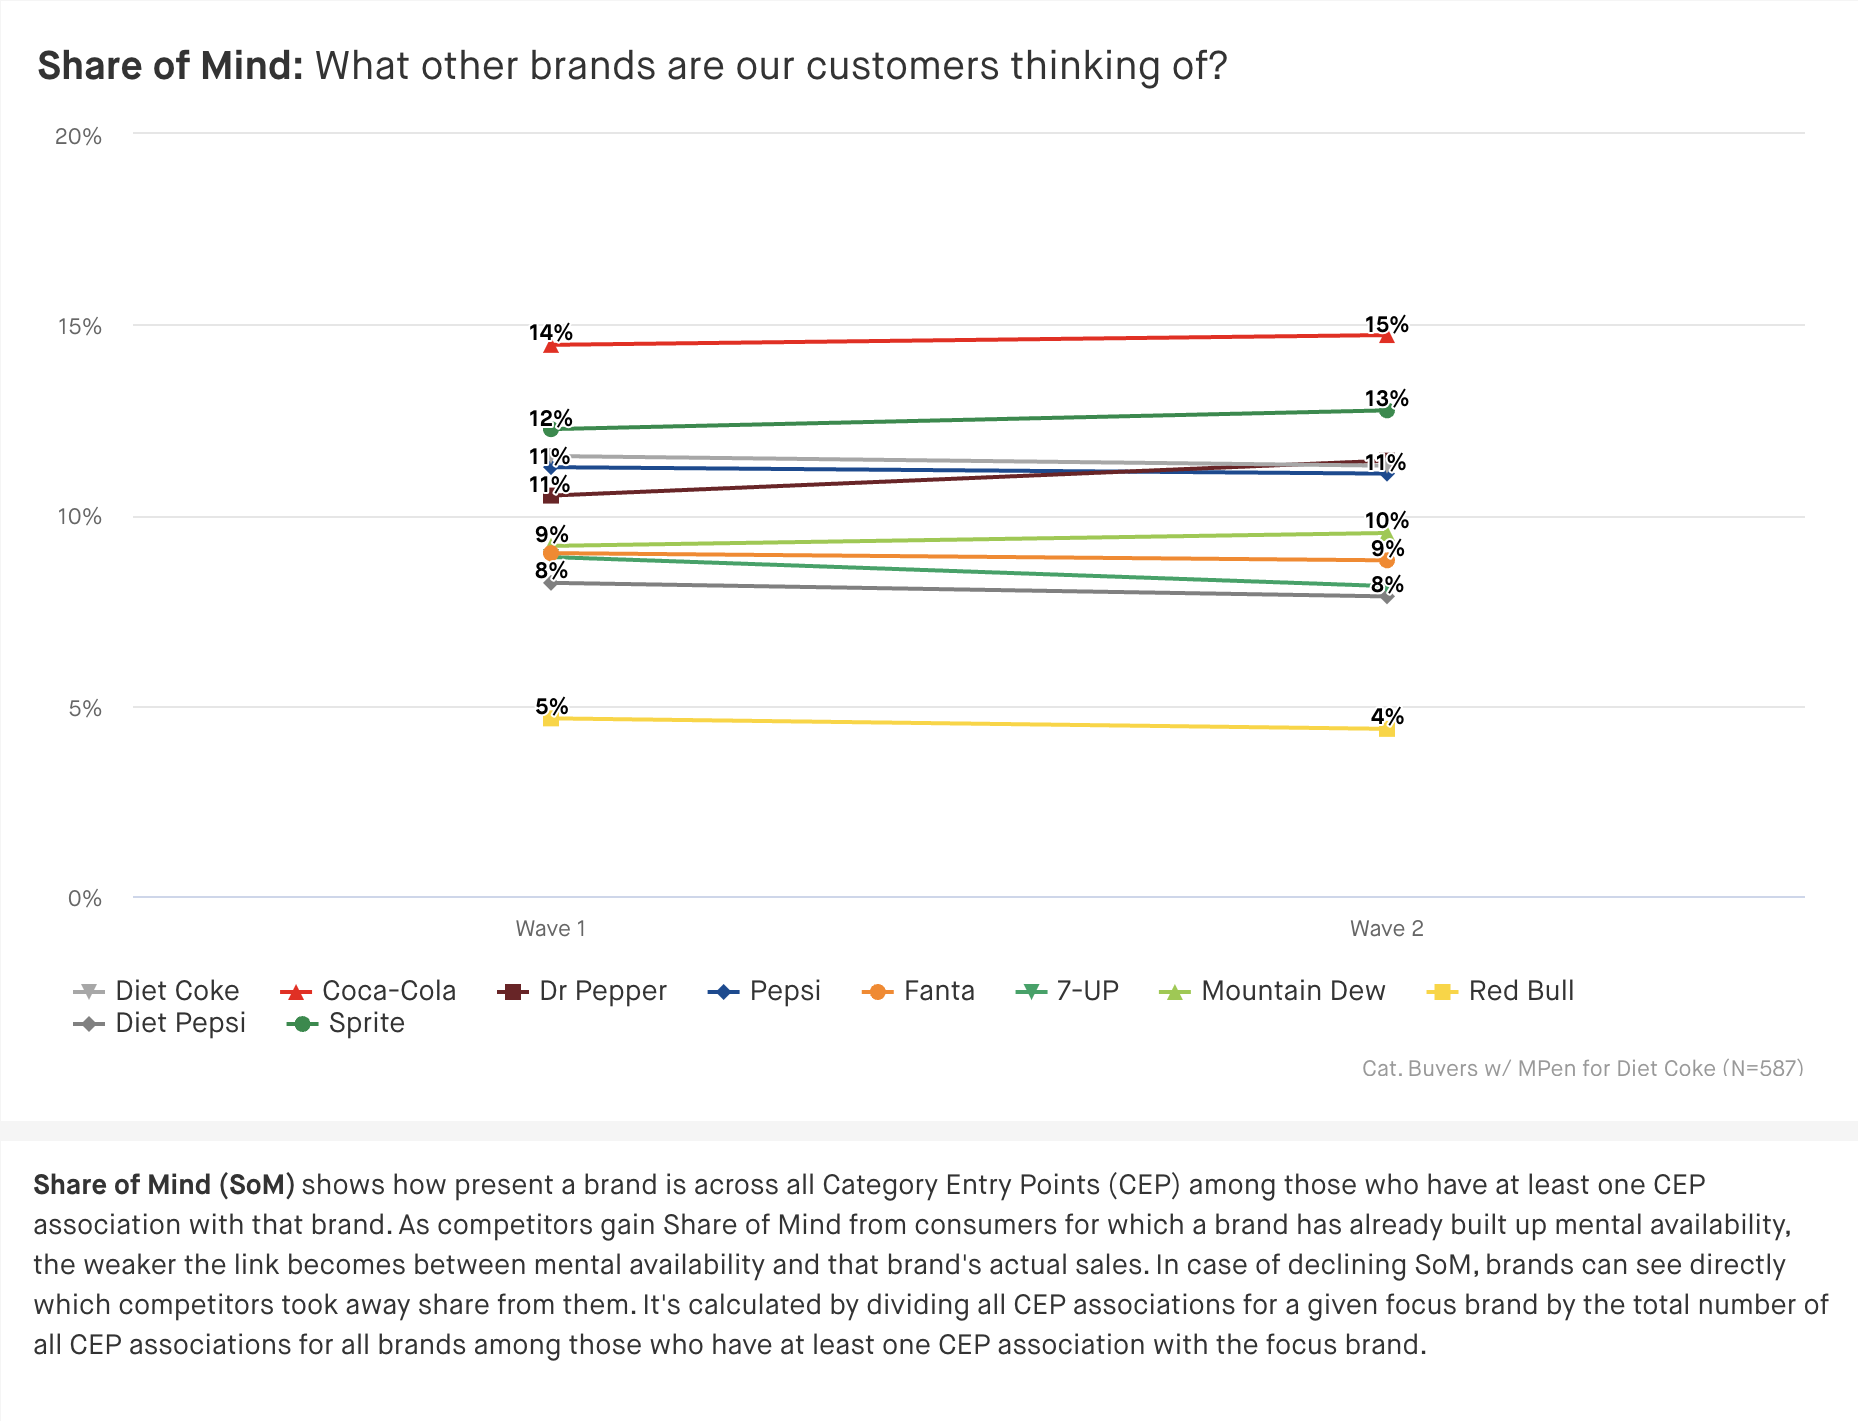
Share of Mind |
What other brands are customers thinking of in addition to a specific brand |
Let’s now further explore what each of these metrics looks like when applied to the soda category:
|
Mental Market Share: |
|
|
Mental Penetration: |
|
|
Network Size: |
|
|
Share of Mind: |
|
To explore more of the data from our soda tracking study, including an intuitive Mental Advantage analysis, access the full dashboard here! Or check out our final BBHT series post: Why You Should Track Mental Availability.


.png)