Quantitative survey questions are designed to elicit clear, non-ambiguous answers that can be quantified and compared across a sample of respondents.
Key Takeaways:
- Structure over spontaneity: Quantitative questions rely on a fixed structure (closed-ended) to ensure data is statistically valid and comparable across large groups.
- The "why" vs. "how many": While qualitative research explores the reasoning (the "why"), quantitative survey questions focus on frequency, scale, and volume (the "how many" or "how much").
- Objectivity is key: The most effective quantitative questions use neutral, unbiased language to prevent "acquiescence bias" (the tendency for respondents to agree with the interviewer).
- Advanced logic integration: Modern quantitative surveys often leverage "skip logic" or "piping" to keep surveys short and relevant, significantly increasing completion rates.
Table of contents:
- Types of quantitative survey questions - with examples
- Quantitative question formats
- How to write quantitative survey questions
- Examples of quantitative survey questions
- Leveraging quantilope for your quantitative survey
In a quantitative research study brands will gather numeric data for most of their questions through formats like numerical scale questions or ranking questions. However, brands can also include some non-quantitative questions throughout their quantitative study - like open-ended questions, where respondents will type in their own feedback to a question prompt. Even so, open-ended answers can be numerically coded to sift through feedback easily (e.g. anyone who writes in 'Pepsi' in a soda study would be assigned the number '1', to look at Pepsi feedback as a whole).
One of the biggest benefits of using a quantitative research approach is that insights around a research topic can undergo statistical analysis; the same can’t be said for qualitative data like focus group feedback or interviews. Another major difference between quantitative and qualitative research methods is that quantitative surveys require respondents to choose from a limited number of choices in a close-ended question - generating clear, actionable takeaways. However, these distinct quantitative takeaways often pair well with freeform qualitative responses - making quant and qual a great team to use together.
The rest of this article focuses on quantitative research, taking a closer look at quantitative survey question types and question formats/layouts.
Back to table of contents
Types of quantitative survey questions - with examples
Quantitative questions come in many forms, each with different benefits depending on your market research objectives. Below we’ll explore some of these quantitative survey question types, which are commonly used together in a single survey to keep things interesting for respondents.
The style of questioning used during quantitative data collection is important, as a good mix of the right types of questions will deliver rich data, limit respondent fatigue, and optimize the response rate. Questionnaires should be enjoyable - and varying the types of quantitative research questions used throughout your survey will help achieve that.
Descriptive survey questions
Descriptive research questions (also known as usage and attitude, or, U&A questions) seek a general indication or prediction about how a group of people behaves or will behave, how that group is characterized, or how a group thinks.
For example, a business might want to know what portion of adult men shave, and how often they do so. To find this out, they will survey men (the target audience) and ask descriptive questions about their frequency of shaving (e.g. daily, a few times a week, once per week, and so on.) Each of these frequencies get assigned a numerical ‘code’ so that it’s simple to chart and analyze the data later on; daily might be assigned ‘5’, a few times a week might be assigned ‘4’, and so on. That way, brands can create charts using the ‘top two’ and ‘bottom two’ values in a descriptive question to view these metrics side by side.
Another business might want to know how important local transit issues are to residents, so quantitative survey questions will allow respondents to indicate the degrees of opinion attached to various transit issues. Perhaps the transit business running this survey would use a sliding numeric scale to see how important a particular issue is.
Comparative survey questions
Comparative research questions are concerned with comparing individuals or groups of people based on one or more variables. These questions might be posed when a business wants to find out which segment of its target audience might be more profitable, or which types of products might appeal to different sets of consumers.
For example, a business might want to know how the popularity of its chocolate bars is spread out across its entire customer base (i.e. do women prefer a certain flavor? Are children drawn to candy bars by certain packaging attributes? etc.). Questions in this case will be designed to profile and ‘compare’ segments of the market.
Other businesses might be looking to compare coffee consumption among older and younger consumers (i.e. demographic segments), the difference in smartphone usage between younger men and women, or how women from different regions differ in their approach to skincare.
Relationship-based survey questions
As the name suggests, relationship-based survey questions are concerned with the relationship between two or more variables within one or more demographic groups. This might be a causal link between one thing and the other - for example, the consumption of caffeine and respondents’ reported energy levels throughout the day. In this case, a coffee or energy drink brand might be interested in how energy levels differ between those who drink their caffeinated line of beverages and those who drink decaf/non-caffeinated beverages.
Alternatively, it might be a case of two or more factors co-existing, without there necessarily being a causal link - for example, a particular type of air freshener being more popular amongst a certain demographic (maybe one that is controlled wirelessly via Bluetooth is more popular among younger homeowners than one that’s plugged into the wall with no controls). Knowing that millennials favor air fresheners which have options for swapping out scents and setting up schedules would be valuable information for new product development.
Advanced method survey questions
Aside from descriptive, comparative, and relationship-based survey questions, brands can opt to include advanced methodologies in their quantitative questionnaire for richer depth. Though advanced methods are more complex in terms of the insights output, quantilope’s Consumer Intelligence Platform automates the setup and analysis of these methods so that researchers of any background or skillset can leverage them with ease.
With quantilope’s pre-programmed suite of 15 advanced methodologies, including MaxDiff, TURF, Implicit, and more, users can drag and drop any of these into a questionnaire and customize for their own market research objectives.
For example, consider a beverage company that’s looking to expand its flavor profiles. This brand would benefit from a MaxDiff which forces respondents to make tradeoff decisions between a set of flavors. A respondent might say that coconut is their most-preferred flavor, and lime their least (when in a consideration set with strawberry), yet later on in the MaxDiff that same respondent may say Strawberry is their most-preferred flavor (over black cherry and kiwi). While this is just one example of an advanced method, instantly you can see how much richer and more actionable these quantitative metrics become compared to a standard usage and attitude question.
Advanced methods can be used alongside descriptive, comparison, or relationship questions to add a new layer of context wherever a business sees fit.
Back to table of contents

Quantitative question formats
So we’ve covered the kinds of quantitative research questions you might want to answer using market research, but how do these translate into the actual format of questions that you might include on your questionnaire?
Thinking ahead to your reporting process during your questionnaire setup is actually quite important, as the available chart types differ among the types of questions asked; some question data is compatible with bar chart displays, others pie charts, others in trended line graphs, etc. Also consider how well the questions you’re asking will translate onto different devices that your respondents might be using to complete the survey (mobile, PC, or tablet); mobile-optimized, conversational surveys achieve up to an 85% completion rate — nearly 4x higher than traditional web forms (Survey Sparrow, 2025).
Single Select questions
Single select questions are the simplest form of quantitative questioning, as respondents are asked to choose just one answer from a list of items, which tend to be ‘either/or’, ‘yes/no’, or ‘true/false’ questions. These questions are useful when you need to get a clear answer without any qualifying nuances.
For example: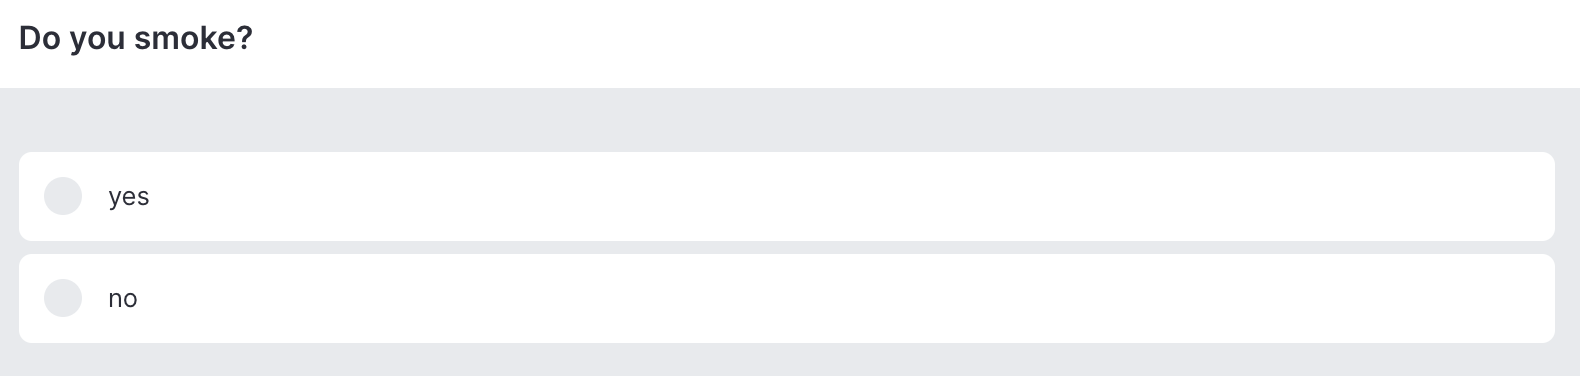
Multi-select questions
Multi-select questions (aka, multiple choice) offer more flexibility for responses, allowing for a number of responses on a single question. Respondents can be asked to ‘check all that apply’ or a cap can be applied (e.g. ‘select up to 3 choices’).
For example:
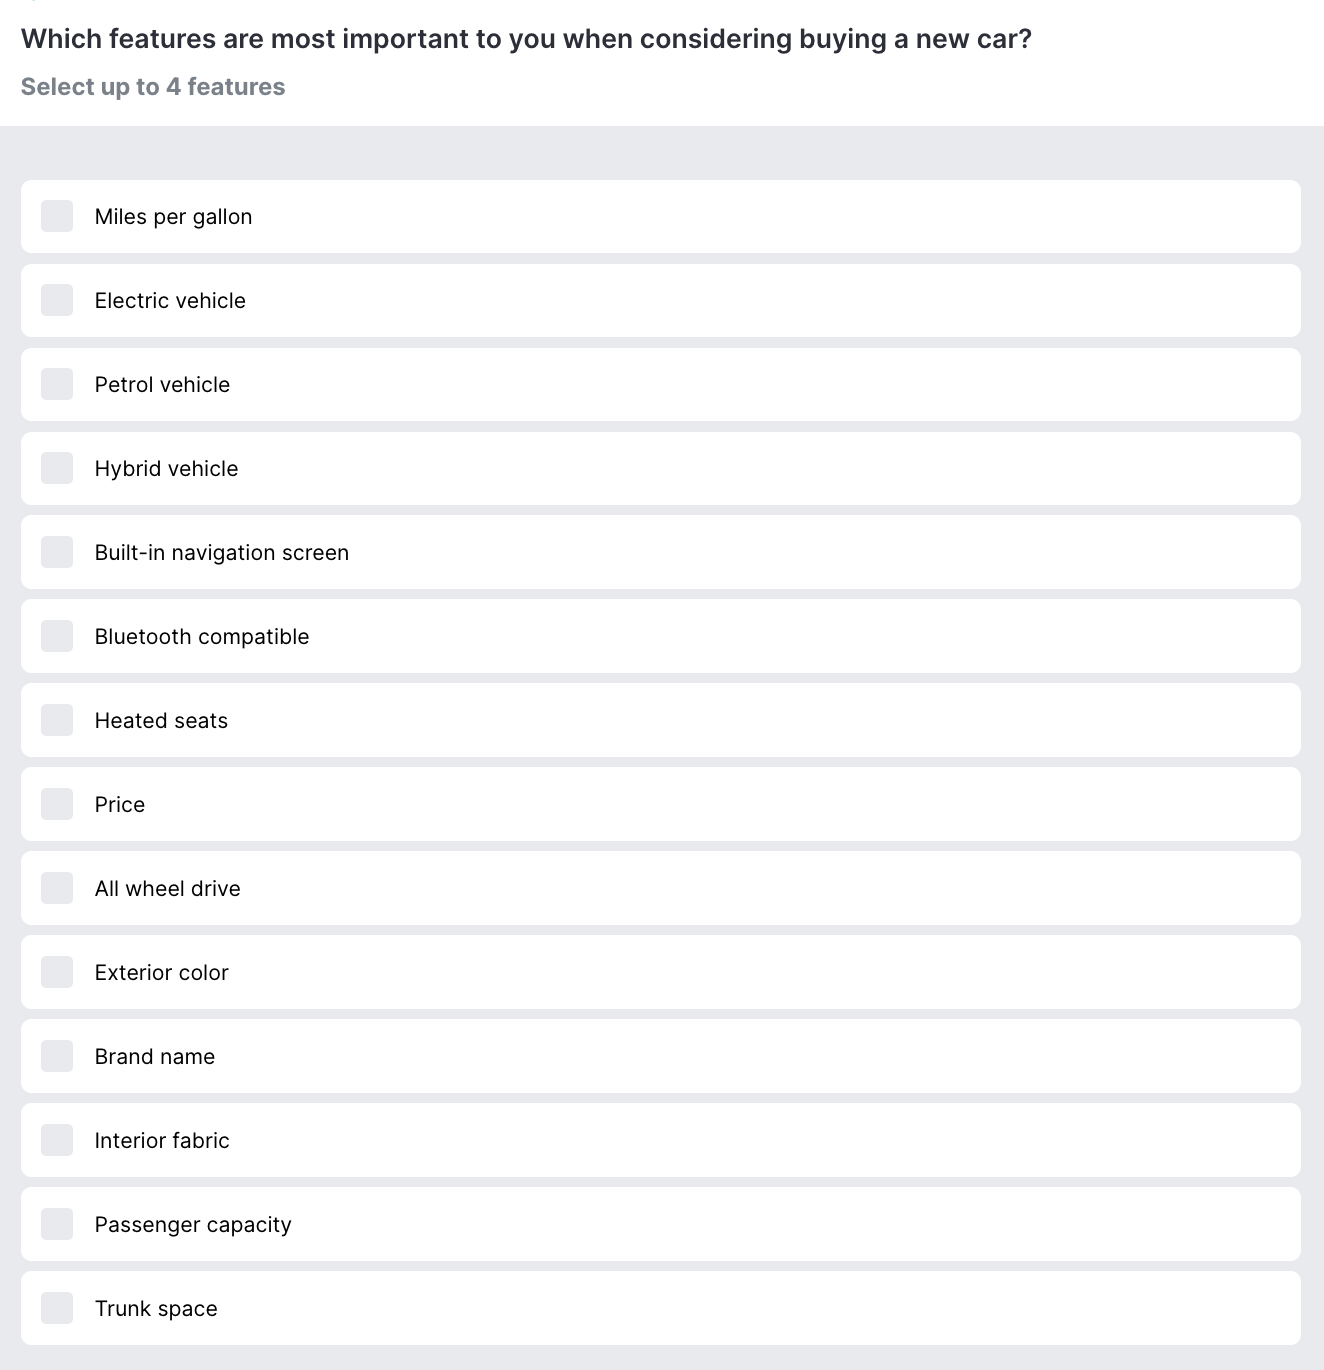
Aside from asking text-based questions like the above examples, a brand could also use a single or multi-select question to ask respondents to select the image they prefer more (like different iterations of a logo design, packaging options, branding colors, etc.).
Likert scale questions
A Likert scale is widely used as a convenient and easy-to-interpret rating method. Respondents find it easy to indicate their degree of feelings by selecting the response they most identify with.
For example: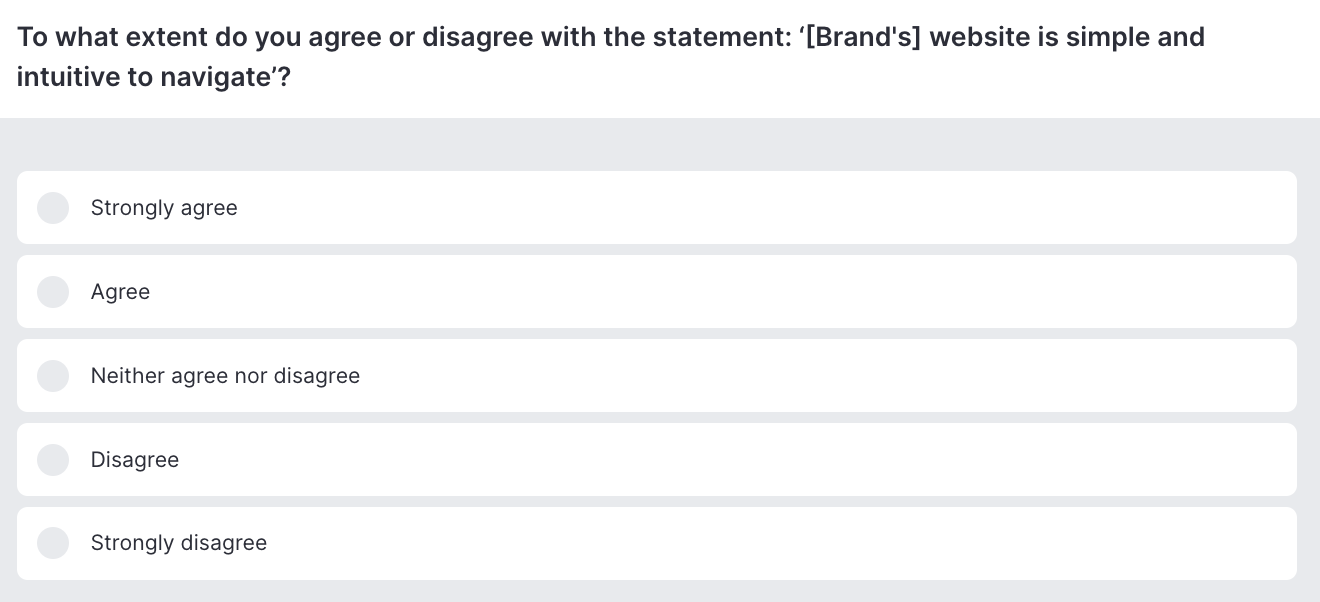
Likert scale questions most often include 5 possible answers, as shown above, but more can be added where needed. One of the most important things to remember when setting up a Likert scale question is to avoid leading questions (e.g. 'How much do you agree that [Brand's] website is simple and intuitive to navigate?'). Asking a question in this fashion already puts into the mind of a respondent that they should agree the website is easy to navigate.
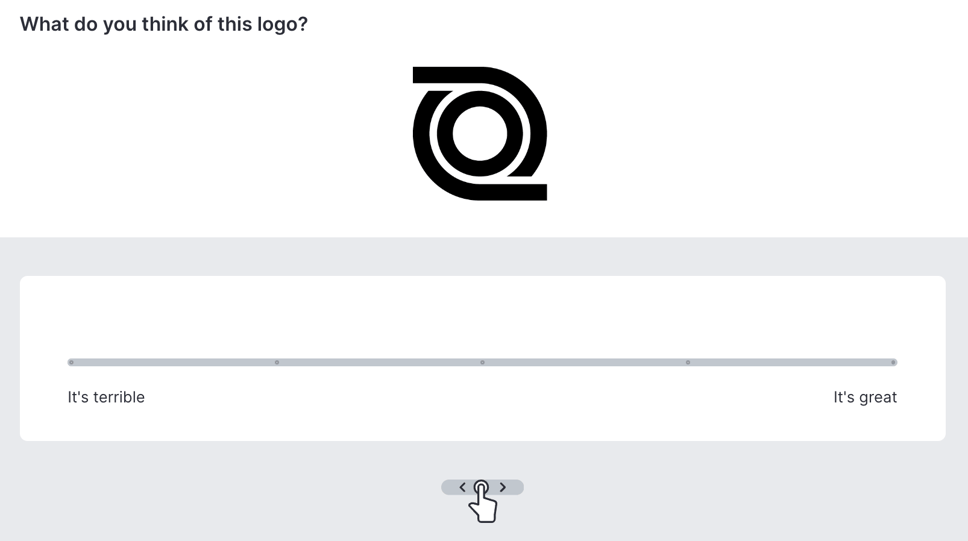
Slider scales
Slider scales are another good interactive way of formatting questions. They allow respondents to customize their level of feeling about a question, with a bit more variance and nuance allowed than a numeric scale:
For example:
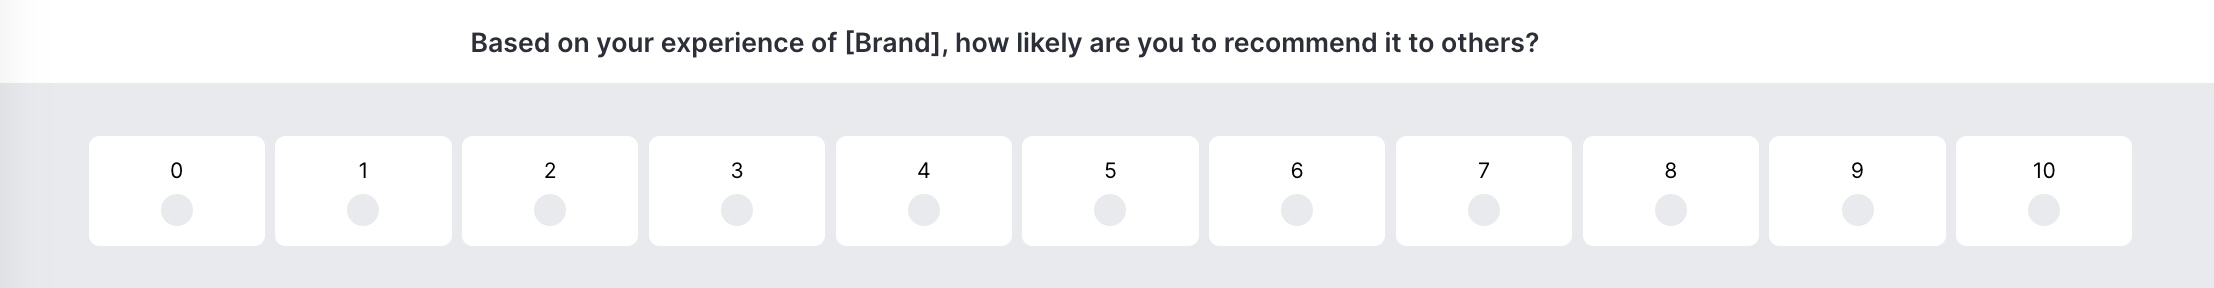
One particularly common use of a slider scale in a market research study is known as a NPS (Net Promoter Score) - a way to measure customer experience and loyalty. A 0-10 scale is used to ask customers how likely they are to recommend a brand’s product or services to others. The NPS score is calculated by subtracting the percentage of ‘detractors’ (those who respond with a 0-6) from the percentage of promoters (those who respond with a 9-10). Respondents who select 7-8 are known as ‘passives’.
For example:
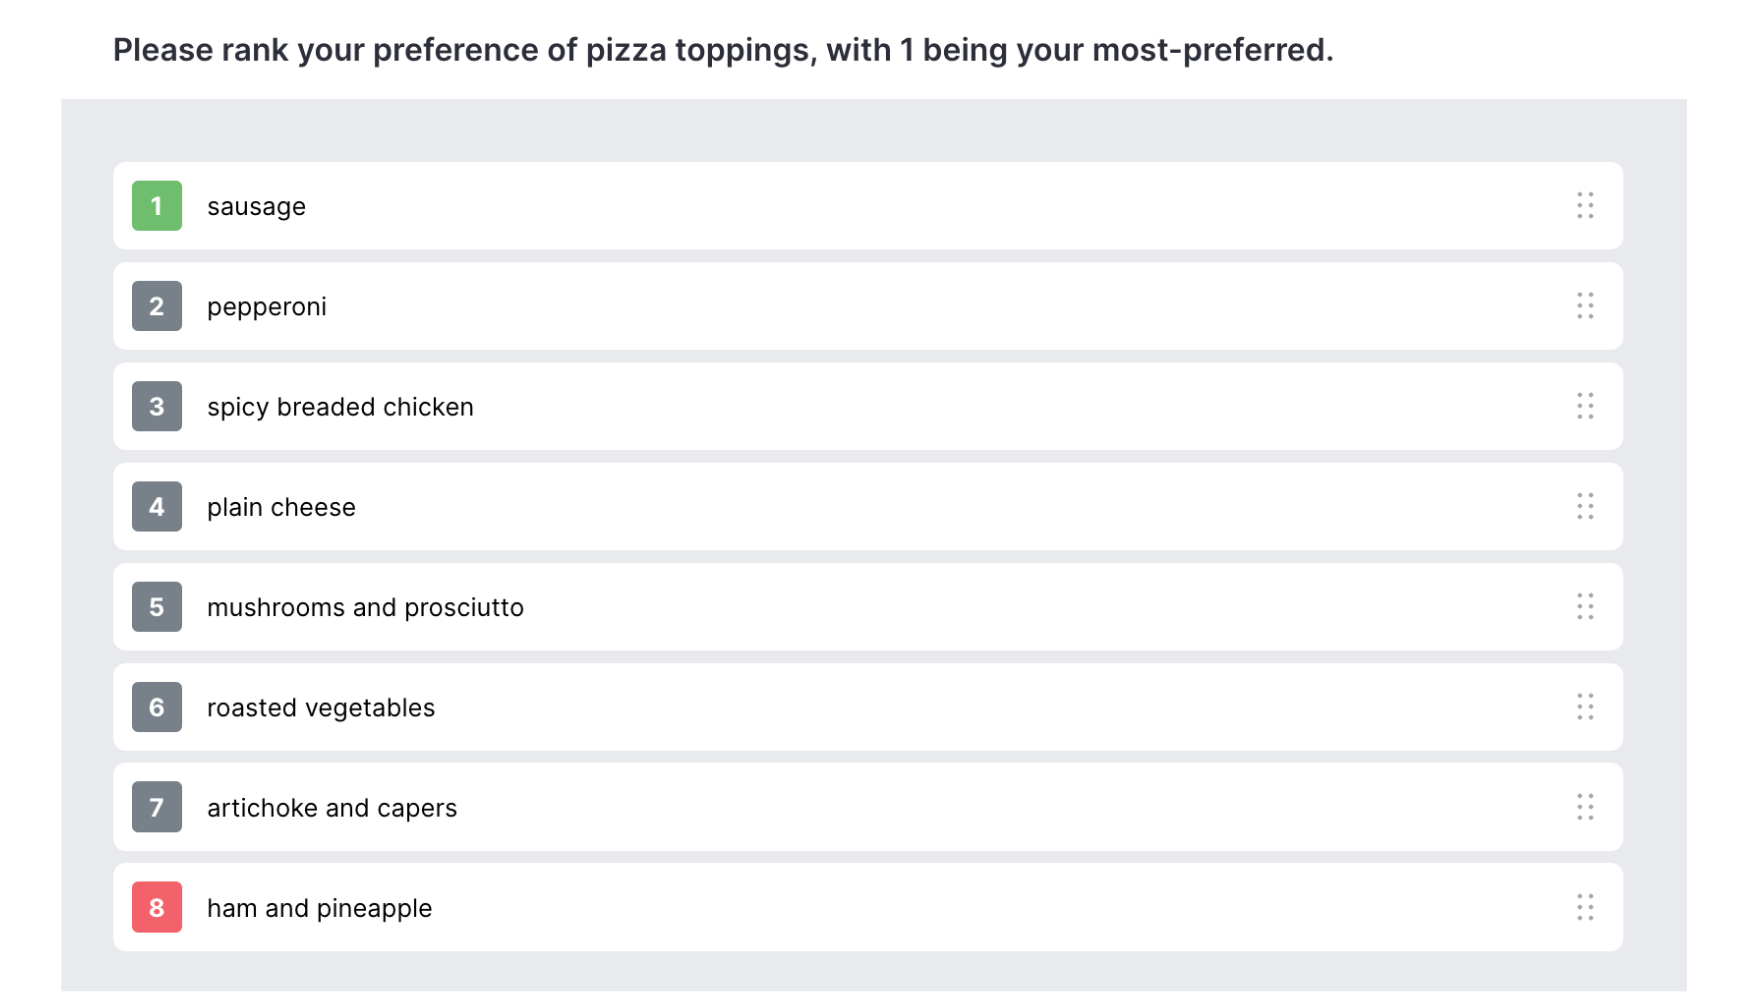
Drag and drop questions
Drag-and-drop question formats are a more ‘gamified’ approach to survey capture as they ask respondents to do more than simply check boxes or slide a scale. Drag-and-drop question formats are great for ranking exercises - asking respondents to place answer options in a certain order by dragging with their mouse.
For example, you could ask survey takers to put pizza toppings in order of preference by dragging options from a list of possible answers to a box displaying their personal preferences:

Matrix questions
Matrix questions are a great way to consolidate a number of questions that ask for the same type of response (e.g. single select yes/no, true/false, or multi-select lists). They are mutually beneficial - making a survey look less daunting for the respondent, and easier for a brand to set up than asking multiple separate questions.
Items in a matrix question are presented one by one, as respondents cycle through the pages selecting one answer for each coffee flavor shown.
For example:
-1.png?width=1500&height=800&name=Untitled%20design%20(5)-1.png)
While the above example shows a single-matrix question - meaning a respondent can only select one answer per element (in this case, coffee flavors), a matrix setup can also be used for multiple-choice questions - allowing respondents to choose multiple answers per element shown, or for rating questions - allowing respondents to assign a rating (e.g. 1-5) for a list of elements at once.
Back to table of contents
How to write quantitative survey questions
We’ve reviewed the types of questions you might ask in a quantitative survey, and how you might format those questions, but now for the actual crafting of the content.
When considering which questions to include in your survey, you’ll first want to establish what your research goals are and how these relate to your business goals. For example, thinking about the three types of quantitative survey questions explained above - descriptive, comparative, and relationship-based - which type (or which combination) will best meet your research needs? The questions you ask respondents may be phrased in similar ways no matter what kind of layout you leverage, but you should have a good idea of how you’ll want to analyze the results as that will make it much easier to correctly set up your survey.
Quantitative questions tend to start with words like ‘how much,’ ‘how often,’ ‘to what degree,’ ‘what do you think of,’ ‘which of the following’ - anything that establishes what consumers do or think and that can be assigned a numerical code or value. Be sure to also include ‘other’ or ‘none of the above’ options in your quant questions, accommodating those who don’t feel the pre-set answers reflect their true opinion. As mentioned earlier, you can always include a small number of open-ended questions in your quant survey to account for any ideas or expanded feedback that the pre-coded questions don’t (or can’t) cover.
Back to table of contents
Examples of quantitative survey questions
Quantitative survey questions impose limits on the answers that respondents can choose from, and this is a good thing when it comes to measuring consumer opinions on a large scale and comparing across respondents. A large volume of freeform, open-ended answers is interesting when looking for themes from qualitative studies, but impractical to wade through when dealing with a large sample size, and impossible to subject to statistical analysis.
For example, a quantitative survey might aim to establish consumers' smartphone habits. This could include their frequency of buying a new smartphone, the considerations that drive purchase, which features they use their phone for, and how much they like their smartphone.
Some examples of quantitative survey questions relating to these habits would be:
Q. How often do you buy a new smartphone?
[single select question]
More than once per year
Every 1-2 years
Every 3-5 years
Every 6+ years
Q. Thinking about when you buy a smartphone, please rank the following factors in order of importance:
[drag and drop ranking question]
brand
price
screen size
storage capacity
Q. How often do you use the following features on your smartphone?
[matrix question]
| Many times daily |
Once per day |
Every few days |
Once |
I do not |
|
| Phone call | |||||
| Text Message | |||||
| Social Media | |||||
| Camera |
Q. How do you feel about your current smartphone?
[sliding scale]
I love it <-------> I hate it
Answers from these above questions, and others within the survey, would be analyzed to paint a picture of smartphone usage and attitude trends across a population and its sub-groups. Qualitative research might then be carried out to explore those findings further - for example, people’s detailed attitudes towards their smartphones, how they feel about the amount of time they spend on it, and how features could be improved.
Back to table of contents
Leveraging quantilope for your quantitative survey
quantilope’s Consumer Intelligence Platform specializes in automated, advanced survey insights so that researchers of any skill level can benefit from quick, high-quality consumer insights. With 15 advanced methods to choose from and a wide variety of quantitative question formats, quantilope is your one-stop-shop for all things market research (including its in-depth qualitative research solution - inColor).
When it comes to building your survey, you decide how you want to go about it. You can start with a blank slate and drop questions into your survey from a pre-programmed list, or you can get a head start with a survey template for a particular business use case (like concept testing) and customize from there. Once your survey is ready to launch, simply specify your target audience, connect any panel (quantilope is panel agnostic), and watch as respondents answer questions in your survey in real-time by monitoring the fieldwork section of your project. AI-driven data analysis takes the raw data and converts it into actionable findings so you never have to worry about manual calculations or statistical testing.
Whether you want to run your quantitative study entirely on your own or with the help of a classically trained research team member, the choice is yours on quantilope’s platform.
For more information on how quantilope can help with your next quantitative research project, get in touch below!