With the rise in automation and artificial intelligence (AI), implementing AI into your market research process using AI market research tools is how modern day businesses will keep up. Automation and AI significantly streamline survey setup and data analysis so you can spend more of your valuable time on strategic planning and on turning insights into action.
This post explores how researchers today can leverage automated data analysis and AI tools for data-backed decision-making - without the time-consuming, manual legwork.
Table of contents
-
How to leverage AI for data analysis and visualization leverage
-
Automated and AI-driven data analysis with quantilope’s platform
- An example of gathering valuable insights through automation and AI
How to leverage AI for data analysis and visualization leverage
AI tools are rapidly growing in popularity across all industries, and using AI for research methodology is no exception. This makes it an exciting time for researchers who wish to do more, with less (less resources, less time, less budget).
Below are a few areas where automation and AI are changing the traditional market research landscape for more efficient, automated data analysis.
-
Survey development:
AI can aid in your data collection process by way of setting up a high-quality survey that asks the right questions to collect actionable insights. For example, AI tools can inspire researchers with ideas for question framing and question inputs - prompting ideas they may not have thought of on their own. -
Data cleaning:
Automated algorithms can automatically identify poor-quality responses and clean them out of your data to ensure a final dataset that’s accurate and reliable. This includes automatically detecting gibberish open-end responses, respondents that speed through your survey faster than average, or respondents that provide illegitimate answering behavior (i.e. red herring questions that serve to ‘trap’ bad respondents who aren’t paying attention). -
Data analysis:
Researchers can leverage AI in their data analysis process to uncover insights they may have missed. Particularly, AI tools can analyze data sources to extract chart headlines and key takeaways with just the click of a button. AI tools can also easily predict analytics within your data; this helps businesses forecast necessary resources and act on new or emerging trends before it’s too late.
-
Data reporting/Automated data visualization:
With the help of AI, researchers can extract overall takeaways from an entire report/dashboard in seconds - leaving end stakeholders with a clear action plan and next steps. Because AI tools can quickly identify patterns, predict trends, and interpret data, researchers are left with intuitive, automated data visualizations for even the most complex advanced research methods.
Back to table of contents
Importance and challenges of relying on AI data analysis
The ongoing development of AI market research tools for data analysis has made it an exciting time to work in the industry. Researchers and data analysts should feel empowered through the ability to lean on AI to streamline tedious analytical tasks and spend more time on the consumer story; the ‘so what’. AI for data analysis accelerates decision making, improves data accuracy, and offers scalability.
However, (and to the likely relief of employed market researchers), artificial intelligence and data analytics automation cannot totally replace the role of insights professionals and researchers. There still remains a need for some human intervention in automated data analysis. AI can inspire and get you started, but every large business decision should be rooted in real discussion and the humanization of data. Additionally, while AI can help reduce researcher bias, there also is the risk of algorithm bias - of which only skilled insights professionals can look for and identify.
The use of AI in data analysis should be for inspiration and guidance in data-driven decision-making, not to entirely replace a seasoned research team. Rather, AI tools can be thought of like another member of the team - a valuable partner that lets your business get more done, with less...the ultimate research dream.
Back to table of contents
Automated and AI-driven data analysis with quantilope’s platform
quantilope’s Consumer Intelligence Platform makes data analytics as simple as a few clicks of your mouse - regardless of your level of research expertise. With machine-learning and AI-driven algorithms happening behind the scenes, you no longer have to spend days (even weeks or months!) waiting for a dataset to come back from a data processing team or a team of data scientists.
Instead, start diving into your data the moment the first few respondents complete your survey. Click between different chart visualizations in seconds, toggle on significance testing without any manual calculations needed, and cut data by any other variable in your survey for a deeper read on your audience. Save your analysis charts as you go, and choose which ones to add to your final insights dashboard to then share with stakeholders.
For example, let’s say you lead the Insights team at a big CPG company (congrats on the impressive gig), and your CEO wants an update from your recently-launched study on a new product release - by end of day nonetheless. Without an automated research tool you might begin to sweat - wondering how long it’s going to take to get preliminary data tabs from your data processing team...despite your ‘urgent’ email subject line.
Fortunately for you, those days are long gone as you simply log into quantilope’s platform and begin to filter/cut data, build reports, and pull together a dashboard in real-time. You even leverage quantilope’s AI Research Partner, quinn, to draft chart headlines and footer descriptions with the click of a button. You click the ‘share’ button at the top right corner of the dashboard and send it over to your CEO in under an hour. That’s modern-day business intelligence.
Alternatively, without a platform like quantilope to automate data analysis, researchers are left scrambling to gather insights from large datasets like Excel spreadsheets or other big data files (assuming they have access to them while in field), manually check the data’s accuracy, input data metrics into charts (with the risk of human error), and craft their own data visualizations from scratch. This kind of analytics process no longer works for stakeholders that want to keep up with the pace of consumers as they’re making decisions.
Automation tools and AI research partners are what separate brands that are leading the market from those who are racing to keep up.
Back to table of contents
An example of gathering valuable insights through automation and AI
As an example of how automation and AI tools can streamline the journey to better business decisions, let’s look at quantilope’s implicit airline study. In this study, we leverage a single and multi implicit association test (SIAT and MIAT) to understand brand perception and what consumers associate with the airline industry.
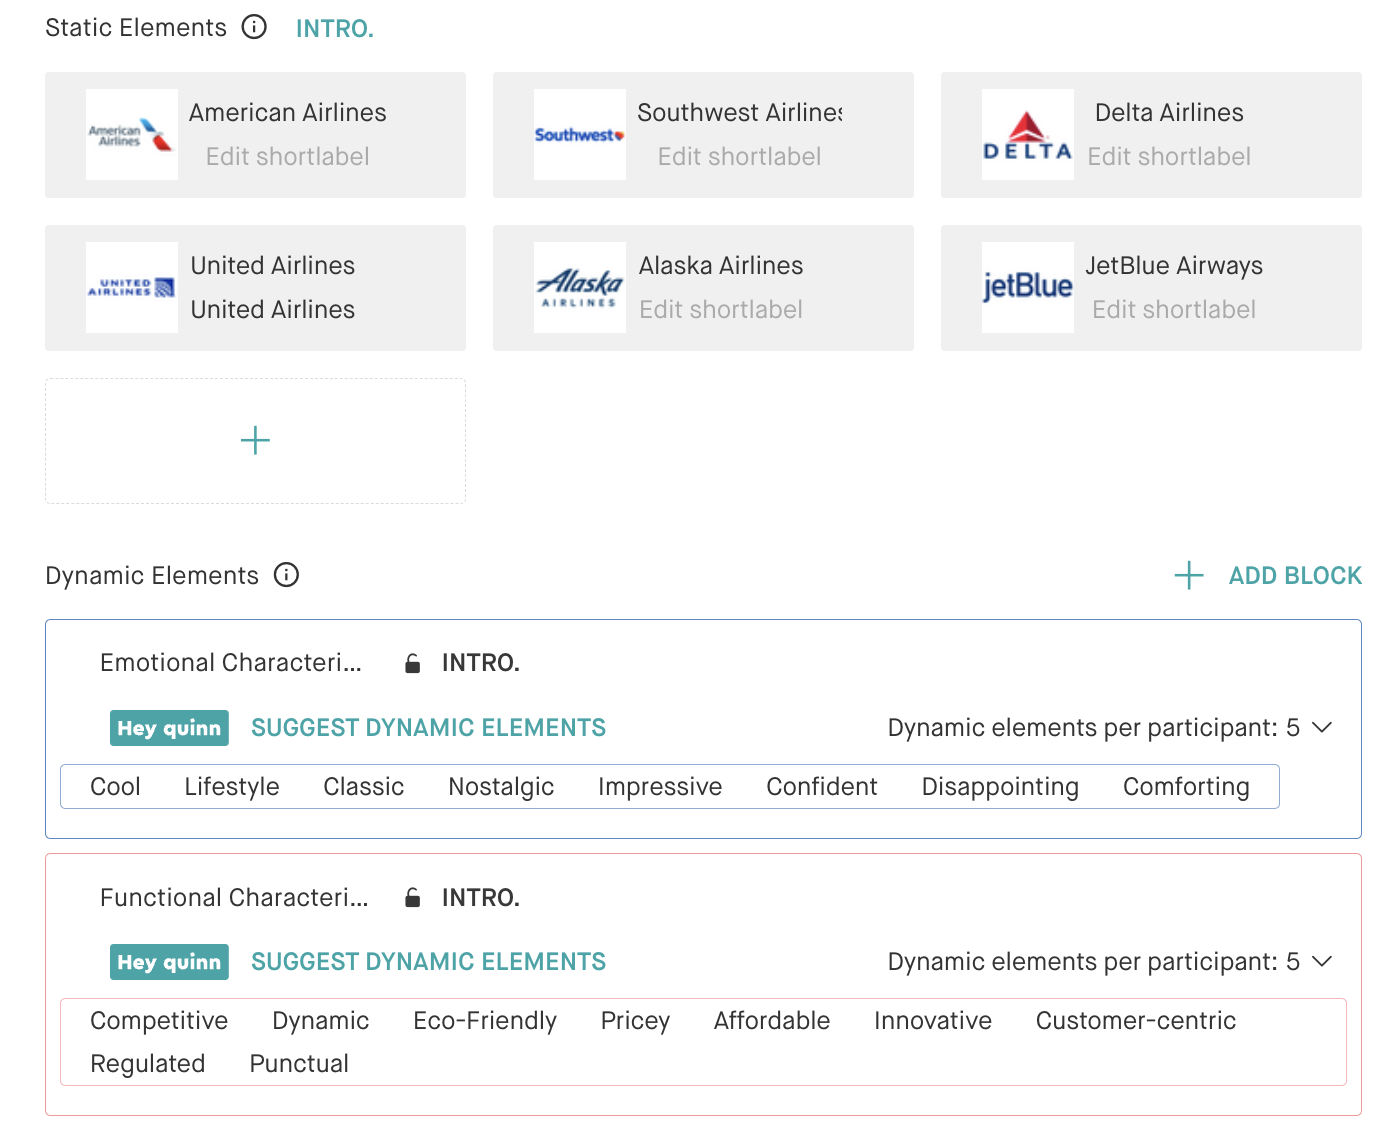
As shown above, we can leverage quinn (quantilope’s integrated AI Research Partner) to suggest dynamic elements inputs for the MIAT (such as cool, lifestyle, competitive, pricey). These are the elements that we’ll test among respondents to see if they subconsciously associate these traits with each airline tested.
Once our AI-powered survey is set up and ready for fieldwork, we’ll monitor results in real-time and begin diving into the analysis. At this stage of our research project, automation takes care of instant charting and statistical analysis (no data science team necessary) so we can focus on the insights story at large. We can build as many charts/graphs as we like and cut/filter by any other profiling variables within our study.
For assistance in chart takeaways, quinn can generate a headline and footer description in seconds with the click of a button: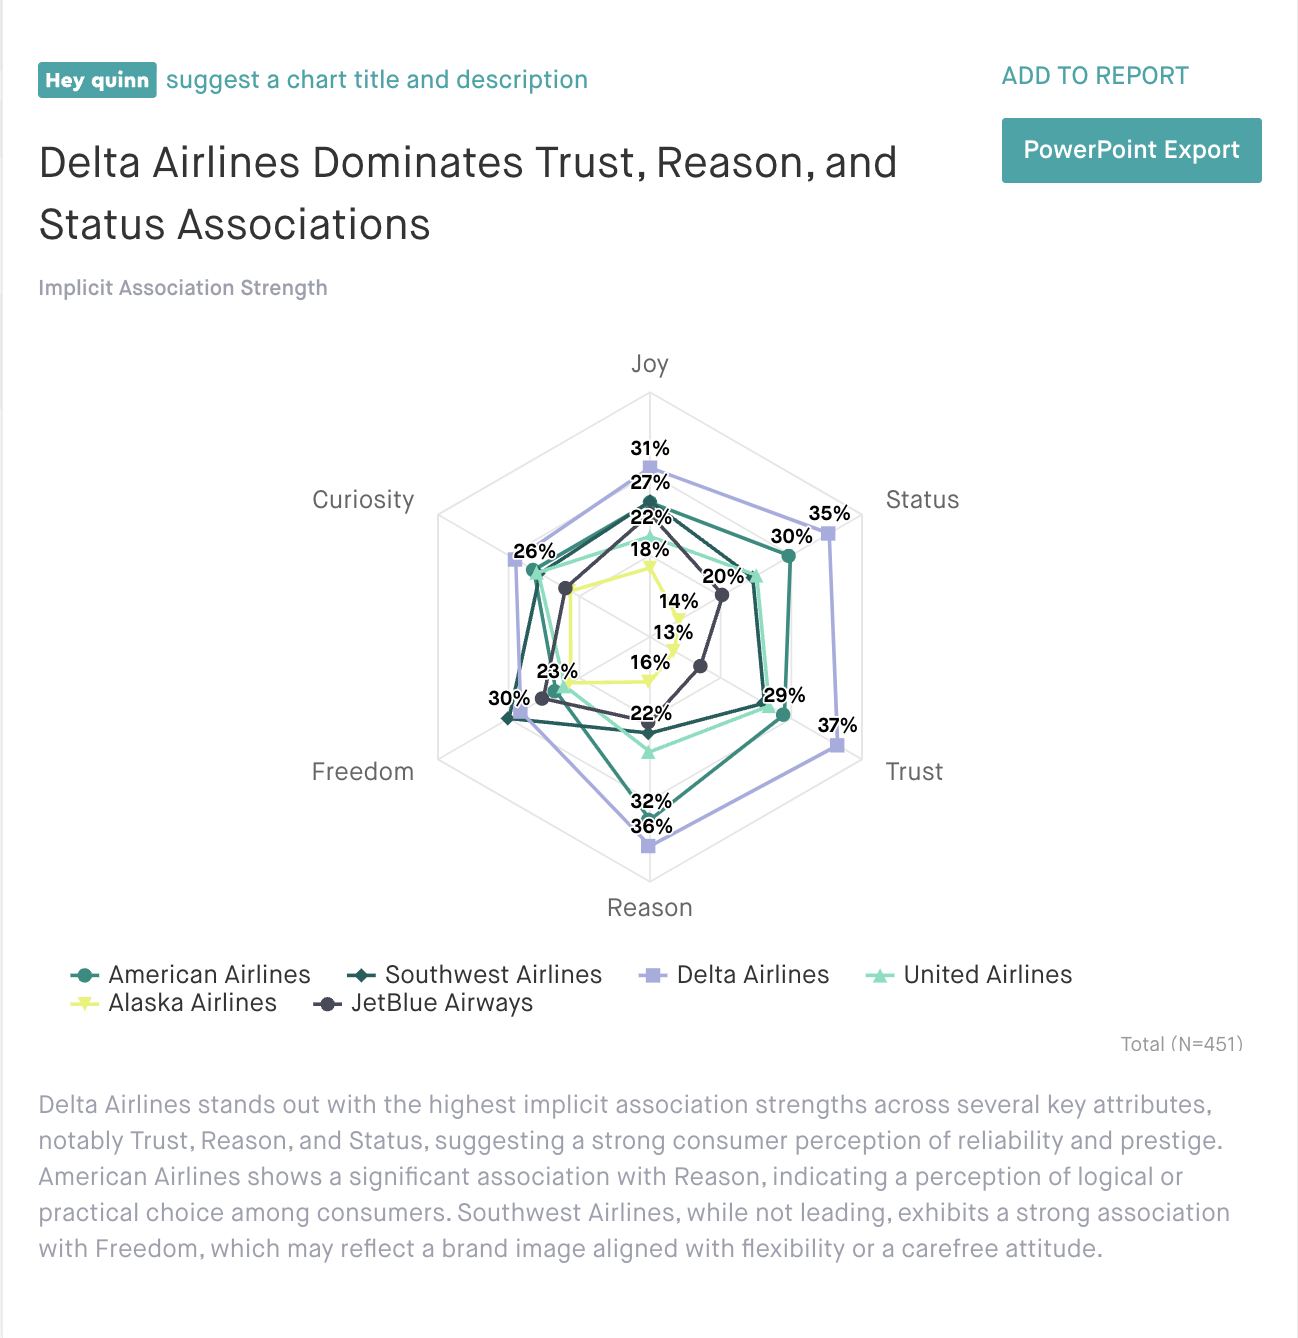
Once we decide on the final charts we want to include in our interactive dashboard, we’ll simply drop those in and ask quinn to aggregate all the dashboard findings into one concise yet comprehensive insights summary - making it easy for stakeholders to digest the big ideas.
Through automation and AI, we’ve been able to streamline our workflow through every step of our insights project from initial survey development (even using a pre-built template to get started) to the final insights dashboard deliverable.
Ready to get started with quantilope's AI-driven Consumer Intelligence Platform for efficient survey setup and automated data analysis? Get in touch!

.png)