
In this blog, read up on five different data collection techniques for quantitative research studies.
Quantitative research forms the basis for many business decisions. But what is quantitative data collection, why is it important, and which data collection methods are used in quantitative research?
Table of Contents:
- What is quantitative data collection?
- The importance of quantitative data collection
- Methods used for quantitative data collection
- Example of a survey showing quantitative data
- Strengths and weaknesses of quantitative data
- Summary
What is quantitative data collection?
Quantitative data collection is the gathering of numeric data that puts consumer insights into a quantifiable context. It typically involves a large number of respondents - large enough to extract statistically reliable findings that can be extrapolated to a larger population.
The actual data collection process for quantitative findings is typically done using a quantitative online questionnaire that asks respondents yes/no questions, ranking scales, rating matrices, and other quantitative question types. With these results, researchers can generate data charts to summarize the quantitative findings and generate easily digestible key takeaways.
Back to Table of Contents
The importance of quantitative data collection
Quantitative data collection can confirm or deny a brand's hypothesis, guide product development, tailor marketing materials, and much more. It provides brands with reliable information to make decisions off of (i.e. 86% like lemon-lime flavor or just 12% are interested in a cinnamon-scented hand soap).
Compared to qualitative data collection, quantitative data allows for comparison between insights given higher base sizes which leads to the ability to have statistical significance. Brands can cut and analyze their dataset in a variety of ways, looking at their findings among different demographic groups, behavioral groups, and other ways of interest. It's also generally easier and quicker to collect quantitative data than it is to gather qualitative feedback, making it an important data collection tool for brands that need quick, reliable, concrete insights.
In order to make justified business decisions from quantitative data, brands need to recruit a high-quality sample that's reflective of their true target market (one that's comprised of all ages/genders rather than an isolated group). For example, a study into usage and attitudes around orange juice might include consumers who buy and/or drink orange juice at a certain frequency or who buy a variety of orange juice brands from different outlets.
Back to Table of Contents

Methods used for quantitative data collection
So knowing what quantitative data collection is and why it's important, how does one go about researching a large, high-quality, representative sample?
Below are five examples of how to conduct your study through various data collection methods:
Online quantitative surveys
Online surveys are a common and effective way of collecting data from a large number of people. In fact, 85% of market research professionals say this is their most-used quantitative method (Backlinko, 2026). Online surveys tend to be made up of closed-ended questions so that responses across the sample are comparable; however, a small number of open-ended questions can be included as well (i.e. questions that require a written response rather than a selection of answers in a close-ended list). Open-ended questions are helpful to gather actual language used by respondents on a certain issue or to collect feedback on a view that might not be shown in a set list of responses).
Online surveys are quick and easy to send out, typically done so through survey panels. They can also appear in pop-ups on websites or via a link embedded in social media. From the participant’s point of view, online surveys are convenient to complete and submit, using whichever device they prefer (mobile phone, tablet, or computer). Anonymity is also viewed as a positive: online survey software ensures respondents’ identities are kept completely confidential.
To gather respondents for online surveys, researchers have several options. Probability sampling is one route, where respondents are selected using a random selection method. As such, everyone within the population has an equal chance of getting selected to participate.
There are four common types of probability sampling.
- Simple random sampling is the most straightforward approach, which involves randomly selecting individuals from the population without any specific criteria or grouping.
- Stratified random sampling divides the population into subgroups (strata) and selects a random sample from each stratum. This is useful when a population includes subgroups that you want to be sure you cover in your research.
- Cluster sampling divides the population into clusters and then randomly selects some of the clusters to sample in their entirety. This is useful when a population is geographically dispersed and it would be impossible to include everyone.
- Systematic sampling begins with a random starting point and then selects every nth member of the population after that point (i.e. every 15th respondent).
Learn how to leverage AI to help generate your online quantitative survey inputs:

While online surveys are by far the most common way to collect quantitative data in today’s modern age, there are still some harder-to-reach respondents where other mediums can be beneficial; for example, those who aren’t tech-savvy or who don’t have a stable internet connection. For these audiences, offline surveys may be needed.
Offline quantitative surveys
Offline surveys (though much rarer to come across these days) are a way of gathering respondent feedback without digital means. This could be something like postal questionnaires that are sent out to a sample population and asked to return the questionnaire by mail (like the Census) or telephone surveys where questions are asked of respondents over the phone.
Offline surveys certainly take longer to collect data than online surveys and they can become expensive if the population is difficult to reach (requiring a higher incentive). As with online surveys, anonymity is protected, assuming the mail is not intercepted or lost.
Despite the major difference in data collection to an online survey approach, offline survey data is still reported on in an aggregated, numeric fashion.
Interviews
In-person interviews are another popular way of researching or polling a population. They can be thought of as a survey but in a verbal, in-person, or virtual face-to-face format. The online format of interviews is becoming more popular nowadays, as it is cheaper and logistically easier to organize than in-person face-to-face interviews, yet still allows the interviewer to see and hear from the respondent in their own words.
Though many interviews are collected for qualitative research, interviews can also be leveraged quantitatively; like a phone survey, an interviewer runs through a survey with the respondent, asking mainly closed-ended questions (yes/no, multiple choice questions, or questions with rating scales that ask how strongly the respondent agrees with statements). The advantage of structured interviews is that the interviewer can pace the survey, making sure the respondent gives enough consideration to each question. It also adds a human touch, which can be more engaging for some respondents. On the other hand, for more sensitive issues, respondents may feel more inclined to complete a survey online for a greater sense of anonymity - so it all depends on your research questions, the survey topic, and the audience you're researching.
Observations
Observation studies in quantitative research are similar in nature to a qualitative ethnographic study (in which a researcher also observes consumers in their natural habitats), yet observation studies for quant research remain focused on the numbers - how many people do an action, how much of a product consumer pick up, etc.
For quantitative observations, researchers will record the number and types of people who do a certain action - such as choosing a specific product from a grocery shelf, speaking to a company representative at an event, or how many people pass through a certain area within a given timeframe. Observation studies are generally structured, with the observer asked to note behavior using set parameters. Structured observation means that the observer has to hone in on very specific behaviors, which can be quite nuanced. This requires the observer to use his/her own judgment about what type of behavior is being exhibited (e.g. reading labels on products before selecting them; considering different items before making the final choice; making a selection based on price).
Document reviews and secondary data sources
A fifth method of data collection for quantitative research is known as secondary research: reviewing existing research to see how it can contribute to understanding a new issue in question. This is in contrast to the primary research methods above, which is research that is specially commissioned and carried out for a research project.
There are numerous secondary data sources that researchers can analyze such as public records, government research, company databases, existing reports, paid-for research publications, magazines, journals, case studies, websites, books, and more.
Aside from using secondary research alone, secondary research documents can also be used in anticipation of primary research, to understand which knowledge gaps need to be filled and to nail down the issues that might be important to explore further in a primary research study.
Back to Table of Contents
Example of a survey showing quantitative data
The below study shows what quantitative data might look like in a final study dashboard, taken from quantilope's Sneaker category insights study.
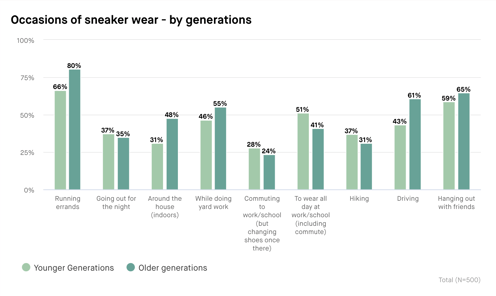
The study includes a variety of usage and attitude metrics around sneaker wear, sneaker purchases, seasonality of sneakers, and more. Check out some of the data charts below showing these quantitative data findings - the first of which even cuts the quantitative data findings by demographics.
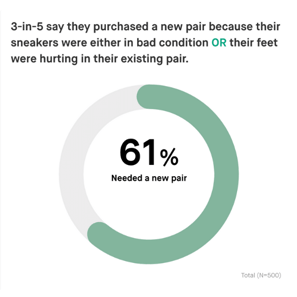
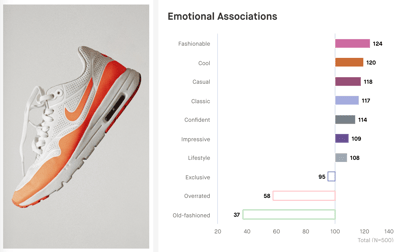
Beyond these basic usage and attitude (or, descriptive) data metrics, quantitative data also includes advanced methods - such as implicit association testing. See what these quantitative data charts look like from the same sneaker study below:

These are just a few examples of how a researcher or insights team might show their quantitative data findings. However, there are many ways to visualize quantitative data in an insights study, from bar charts, column charts, pie charts, donut charts, spider charts, and more, depending on what best suits the story your data is telling.
Back to Table of Contents
Strengths and weaknesses of quantitative data collection
Strengths
quantitative data is a great way to capture informative insights about your brand, product, category, or competitors. It's relatively quick, depending on your sample audience, and more affordable than other data collection methods such as qualitative focus groups. With quantitative panels, it's easy to access nearly any audience you might need - from something as general as the US population to something as specific as cannabis users. There are many ways to visualize quantitative findings, making it a customizable form of insights - whether you want to show the data in a bar chart, pie chart, etc.
For those looking for quick, affordable, actionable insights, quantitative studies are the way to go.
Weaknesses
quantitative data collection, despite the many benefits outlined above, might also not be the right fit for your exact needs. For example, you often don't get as detailed and in-depth answers quantitatively as you would with an in-person interview, focus group, or ethnographic observation (all forms of qualitative research).
When running a quantitative survey, it’s best practice to review your data for quality measures to ensure all respondents are ones you want to keep in your data set. Fortunately, there are a lot of precautions research providers can take to navigate these obstacles - such as automated data cleaners and data flags. Of course, the first step to ensuring high-quality results is to use a trusted panel provider.
Back to Table of Contents
Summary
Quantitative research typically needs to undergo statistical analysis for it to be useful and actionable to any business. It is therefore crucial that the method of data collection, sample size, and sample criteria are considered in light of the research questions asked.
quantilope’s Consumer Intelligence Platform is ideal for quantitative research studies. The online format means a large sample can be reached easily and quickly through connected respondent panels that effectively reach the desired target audience. Response rates are high, as respondents can take their survey from anywhere, using any device with internet access.
Surveys are easy to build with quantilope’s online survey builder. Simply choose questions to include from pre-designed survey templates or build your own questions using the platform’s drag & drop functionality (of which both options are fully customizable). Once the survey is live, findings update in real-time so that brands can get an idea of consumer attitudes long before the survey is complete. In addition to basic usage and attitude questions, quantilope’s suite of advanced research methodologies provides an AI-driven approach to many types of research questions. These range from exploring the features of products that drive purchase through a Key Driver Analysis, compiling the ideal portfolio of products using a TURF, or identifying the optimal price point for a product or service using a Price Sensitivity Meter (PSM).
Depending on the type of data sought it might be worth considering a mixed-method approach, including both qual and quant in a single research study. Alongside quantitative online surveys, quantilope’s video research solution - inColor, offers qualitative research in the form of videoed responses to survey questions. inColor’s qualitative data analysis includes an AI-drive read on respondent sentiment, keyword trends, and facial expressions.
To find out more about how quantilope can help with any aspect of your research design and to start conducting high-quality, quantitative research, get in touch below!
Frequently Asked Questions:


.png)