
quantilope’s latest Consumer Electronics study will leave readers with an understanding of the most important trends and shopping behaviors in the consumer electronics space, in a European market comparison. In this blog post, you will learn which smart watch features are particularly important, and how brands can easily uncover drivers of consumer satisfaction using advanced market research methods.
Smart watches are in vogue. On average, one-in-five European consumers (UK, Germany, France, and Spain) own a smart watch - and in Spain, as many as one-in-four do (Fig. 1). Additionally, there is a remarkably high level of satisfaction with these wearables; 82 percent of surveyed smart watch owners confirmed a ‘high’ to ‘very high’ level of satisfaction with their device.
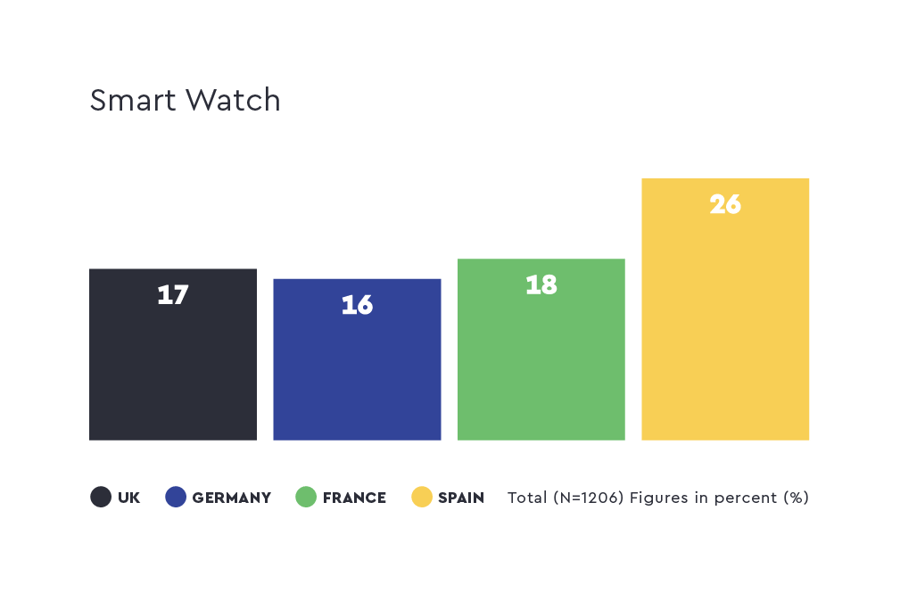
Fig. 1: Smart watch owners | split by country
We further applied an automated key driver analysis (KDA) to determine which specific features positively influence satisfaction with an electronic device, such as a smart watch. We also used this KDA to determine (and provide) recommendations on ways to increase satisfaction within the wearable market.
About the method:
A key driver analysis (KDA) is a proven, advanced quantitative market research method. With the help of an automated KDA, brands can gain deep insights about their target group and uncover relevant drivers of an outcome within a few days.
Methodologically, a KDA is also valuable for brands as it determines driver importance indirectly, using a multivariate statistical analysis. Respondents often find it difficult to evaluate the importance of individual drivers, and tend to consider everything as important (ceiling effect). KDA solves this problem through its indirect approach, thus enabling valid and impactful results.
Three features that are driving satisfaction with smart watches
Smart watches are particularly appealing due to their navigation, fitness tracker and smart home control features (Fig. 2). Brands that pay special attention to these three features during product development can positively influence satisfaction with this popular wearable device.
To determine the decisive drivers, both the overall outcome (satisfaction with smart watches) and the individual drivers (satisfaction with specific features of a smart watch) were surveyed on a 5-point scale, from "very dissatisfied" to "very satisfied". The KDA then determines the importance these individual features have in influencing overall satisfaction, as seen in the ‘Key Driver Importance Chart’ below (Fig. 2).
Each driver's importance score can be interpreted relative to other drivers, with the most important driver always scaled to 100. For example, a feature with the value 50 is twice as important for overall satisfaction compared to a feature with the value 25.
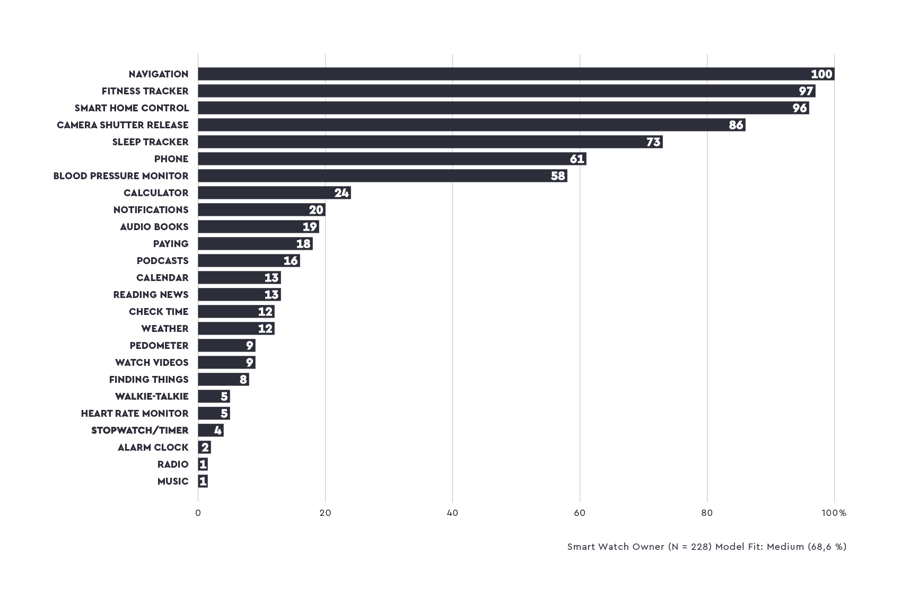
Fig. 2: Key Driver Importance | Satisfaction with owned smart watch
How to systematically boost satisfaction with smart watches
The Importance-Performance Matrix (Fig. 3) visualizes and conveys each driver’s importance and performance, relative to others. In this way, brands can easily prioritize which features or areas to focus on in order to increase overall satisfaction with a smart watch.
On average, respondents are satisfied with two of the three strongest drivers of smart watch satisfaction that are shown above in Fig. 2. However, not all are currently performing optimally.
For example, we know fitness tracking is an important feature of a smart watch and positively drives overall satisfaction. The performance of a ‘fitness tracker’ in this example is good (shown in the upper right quadrant of Fig. 3), indicating that there is no need for action. On the other hand, the ‘smart home control’ feature is shown in the bottom right quadrant of Fig. 3, indicating potential room for improvement when it comes to performance. With this in mind, a smart watch brand who focuses on improving the functionalities for smart home controls would likely benefit from an increase in overall consumer satisfaction with their device.
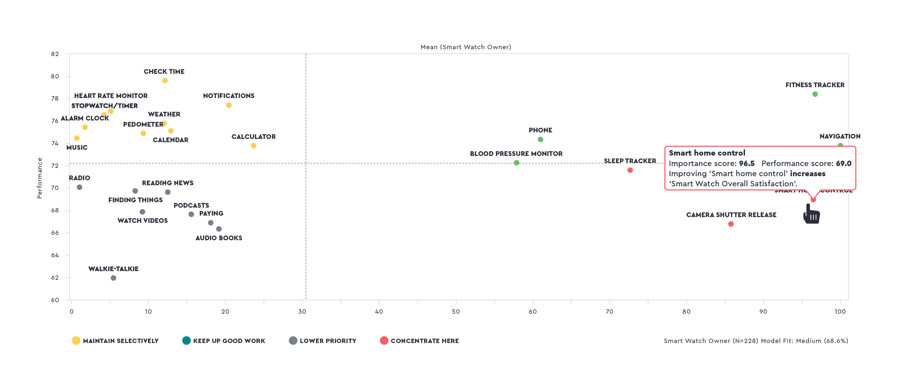
Fig. 3: Importance-Performance Matrix | Satisfaction with own smart watch
quantilope's end-to-end platform supports users in the application and evaluation of a KDA with practical tips and concrete recommendations. For example, traffic light colors within the Importance-Performance Matrix provide the recommendations for action (e.g. red = concentrate here). In addition, users can hover over each individual driver to see to what extent changing it would affect the overall satisfaction (e.g. improving the "smart home control" feature would lead to an increase in overall satisfaction with smart watches).
For many more insights around our 2021 Consumer Electronics Study, download the insights dashboard below and check out our subsequent blog post: Consumer Electronics – the latest Insights in a European comparison
Sample information:
N = 1,600 European respondents from the U.K., Germany, France, and Spain (with n = 400 per country). The main sample is representative of the respective country in terms of age and gender. For specific smart watch and smart home questions, we surveyed a boost among owners of these respective devices.


.png)