
In this blog, learn about each of quantilope’s 15 automated advanced research methods and examples of when to leverage them in your quantitative research studies.
This post should act as a continual reference point for: businesses learning how to measure brand value and capture detailed quantitative data; students working on a research project; clients crafting a research proposal; or anyone looking to conduct statistical analysis on a dataset but doesn't have a statistics background.
quantilope’s advanced methods help brands stay current with market research trends and are listed below in alphabetical order for ease of reference:
Table of Contents:
(Listed alphabetically)
- A/B Test (Monadic)
- A/B Pre-Roll Test
- Choice-Based Conjoint (CBC)
- inColor
- Key Driver Analysis (KDA)
- Maximum Difference Scaling (MaxDiff)
- Mental Advantage Analysis
- Mental Availability Analysis
- Multi Implicit Association Test (MIAT)
- Net Promoter Score (NPS)
- Penalty-Reward Analysis; aka KANO
- Segmentation
- Single Implicit Association Test (SIAT)
- Total Unduplicated Reach and Frequency (TURF)
- Van Westendorp/Price Sensitivity Meter (PSM)
- Advanced method research with quantilope
A/B Test (Monadic) for comparing items in structured groups
An A/B Monadic test is used to compare a set of product concepts, communications, packages, or advertising collateral. With a monadic test, survey respondents are broken into equally structured groups so that each group sees just one of the stimuli and you are able to compare results for each item to find your winner.
Say you have an advertisement concept you’d like to test before you dedicate marketing budget toward it and it ends up being a flop. You design two versions of the ad - one with a dark background and light font and the other with a light background and dark font. You apply these two stimuli to your A/B test within the survey, and the method automatically routes respondents to one of them, based on least-fill criteria in order to remain equal distribution.
The respondents who see the ad concept with a light background and dark font responded overwhelmingly favorably toward the concept while those who saw the version with a dark background and light font said it was hard to read, and difficult on the eyes. With these results, you know to proceed with the light background version of the ad, knowing that it will generate a positive impact.
For another example of an A/B Monadic Test - check out quantilope’s syndicated study on cereals.
Back to Table of Contents
A/B Pre-Roll Test for finalizing digital ad campaigns
Similar to an A/B Monadic Test, an A/B Pre-roll test is designed specifically to test reactions to an ad concept before it goes live. This is a helpful methodology to leverage when you have a digital ad that’s just about finalized, and you want to know if consumers are paying attention to the right parts of your ad, which parts of the ad are most interesting, when they decide to skip, etc.
The A/B Preroll test provides...
An intuitive, real-world consumer experience. Respondents are given the option to skip ads the same way they might when watching an online video or tv program.
-
A reliable comparison between ads due to the identical structure of respondent groups and no order bias.
-
The ad’s drop-off rate, which is the % of participants that skipped the ad after a certain number of seconds - this signals to the brand that they might want to make some adjustments to maintain interest.
-
View-through rate, which is the % of participants who watched the ad all the way to the end - the goal of brands’ advertising efforts.
Learn more about the A/B Pre-Roll test here.
Back to Table of Contents
Choice-Based Conjoint for building your product
Choice-Based Conjoint is a quantitative research methodology that’s great for optimizing your product by determining which features it should include, and at what price point. The research design for this method works by showing respondents a series of completed products, each with its own list of features - be it price, scent, flavor, ingredients, package size, etc.
Respondents will review these product options as a whole, and decide which is most ideal for their needs. From these selections, brands can determine the specific features that consumers consider most attractive when considering overall products (i.e. do consumers care more about price than package size?) and how important they are to a consumer’s ultimate purchase decision.
Choice-Based Conjoint provides valuable context for brands, allowing them to know which specific features to prioritize rather than simply knowing if consumers like/dislike a product concept as a whole. It closely mimics a real-world scenario where consumers are comparing products on the shelf for ingredients, cheapest prices, best value, etc.
To learn more about quantilope’s choice-based conjoint, check out a conjoint study on 5G networks (see screenshot below), a customer success story/case study from Pax, or watch this webinar recording showing how to set this advanced method up on the platform.
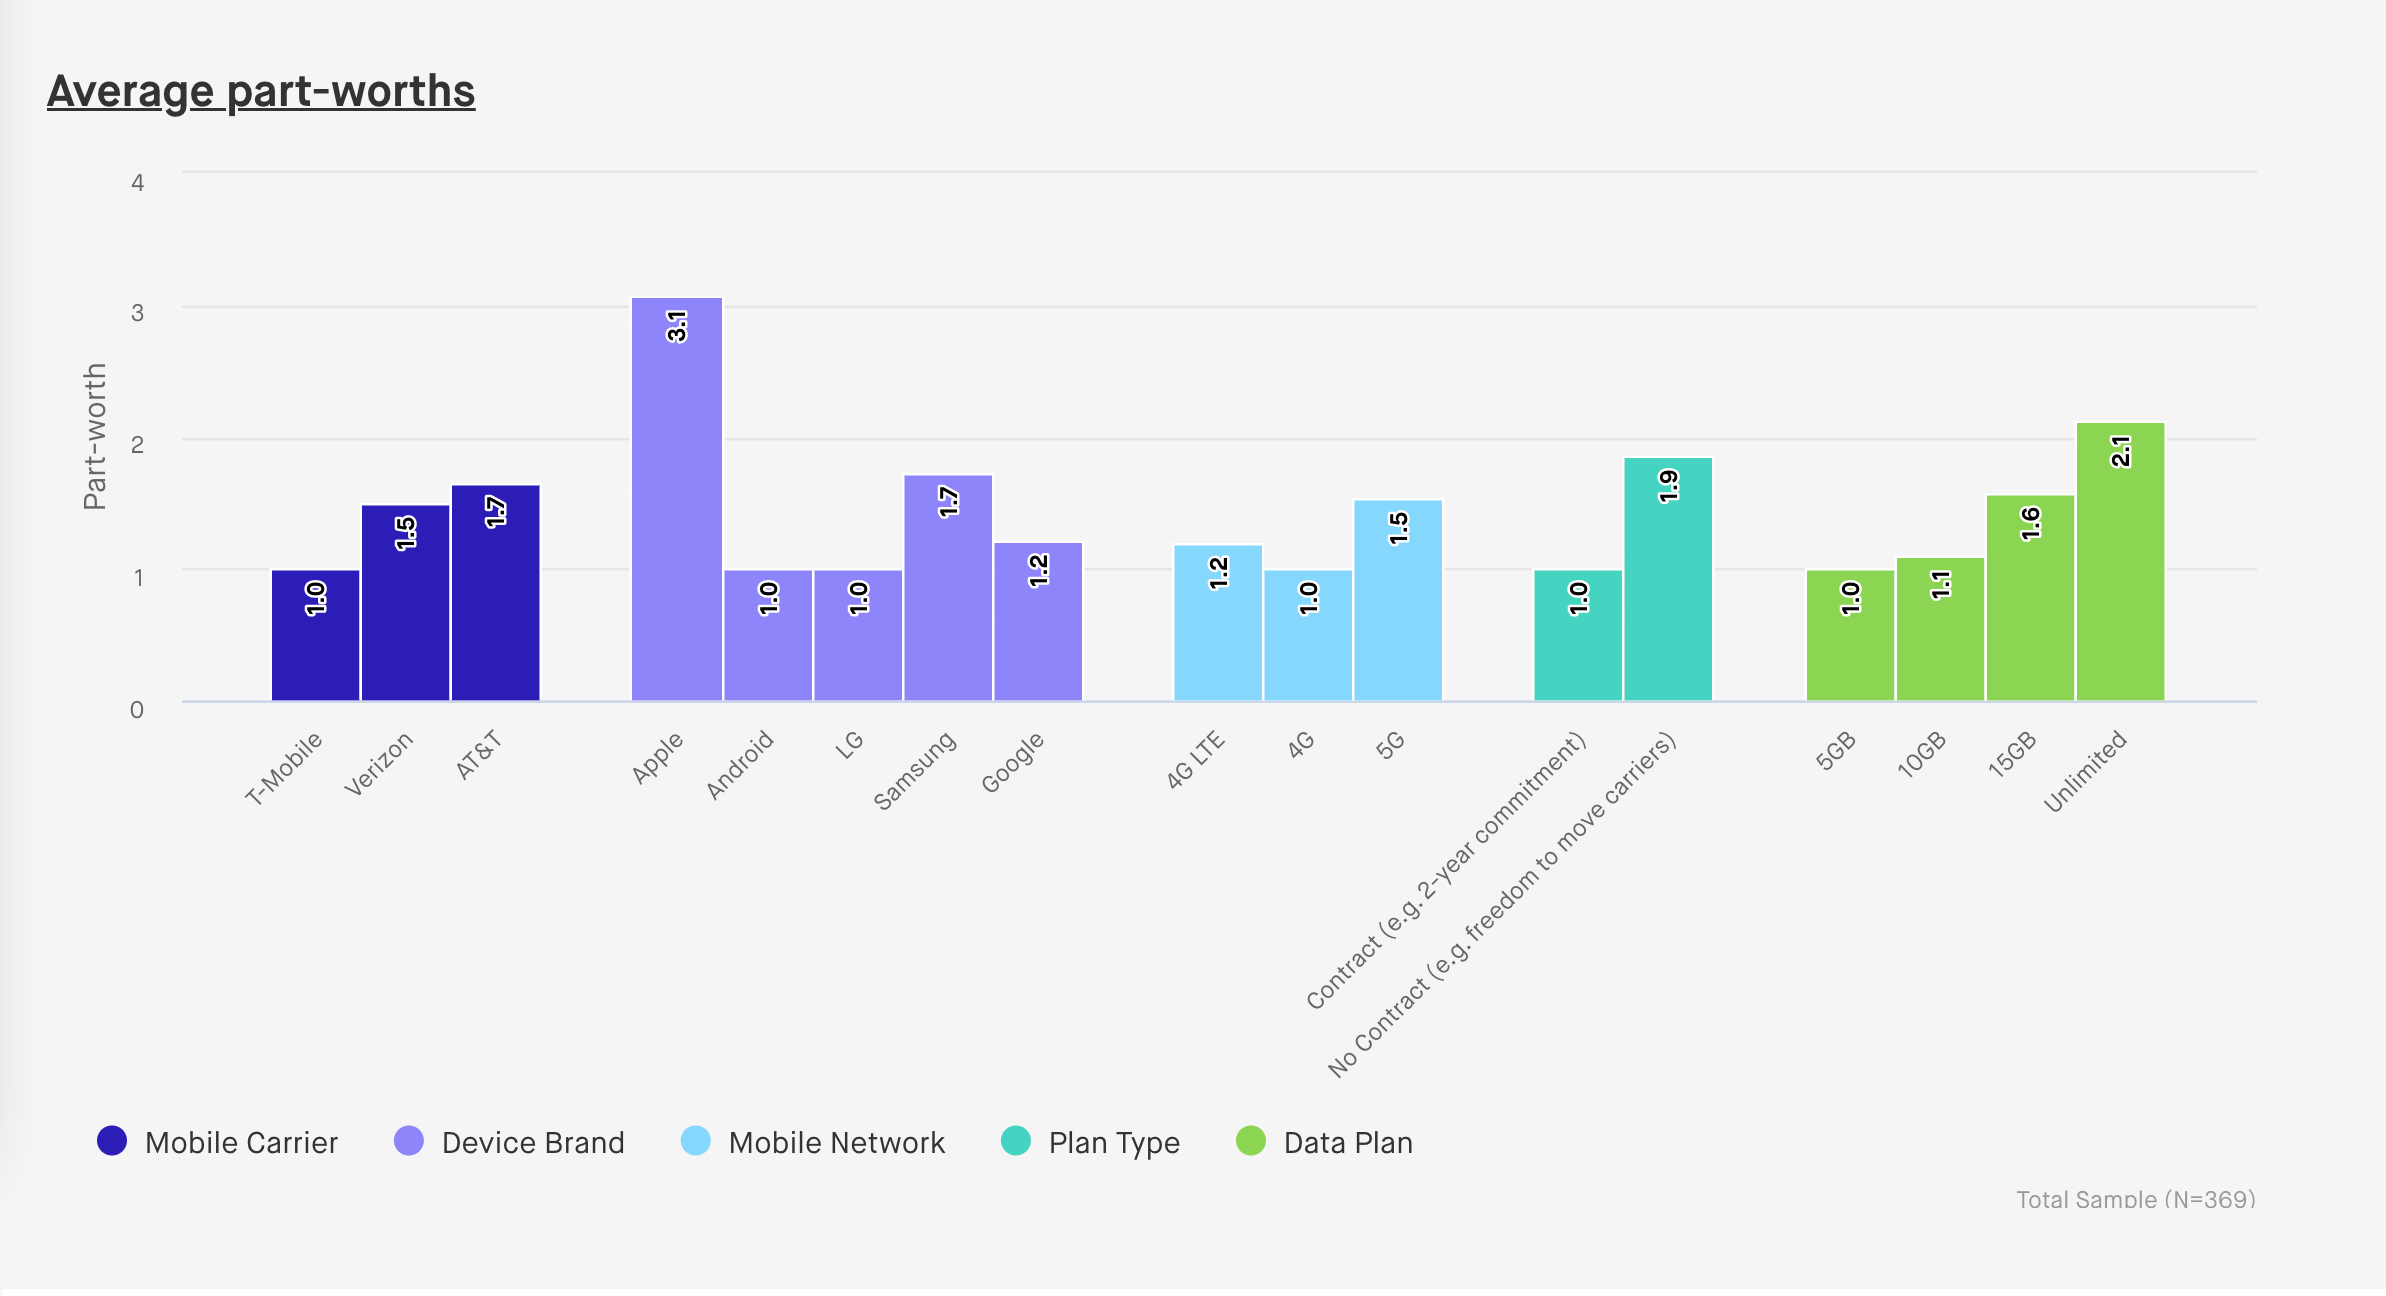 The screenshot above shows 'average part-worths' which represents the strength of different product attributes. The higher the part-worth, the more impact it will have on purchase likelihood.
inColor for video-based consumer feedback
quantilope's inColor tool is an AI-driven, qualitative, video research solution enabling researchers to capture authentic consumer feedback in their own words. Video research not only collects detailed consumer feedback based on the questions asked, it also provides researchers with helpful context around consumers' mannerisms, moods, sentiments, and more.
inColor works by gathering video responses to a research team's unique business questions. These could be questions like 'Tell me about your last purchase experience of xyz', or, 'How does this product/service make you feel when you use it?'. It allows consumers to go in-depth about their perceptions and experiences with a brand, product, or service. inColor automatically analyzes consumer responses to these questions and categorizes feedback based on keywords, facial expressions, and sentiments (positive/negative).
quantilope's AI co-pilot, quinn, even takes it a step further to automatically generate a showreel combining all consumer responses that answer a particular research question. For example, a researcher could ask quinn to generate a showreel highlighting the pain points of their product, and within seconds, quinn will identify the particular segments within each respondent's overall video response that specifically answers that question. This saves a lot of time, letting the research team focus on the results and insights instead of manually combing through all qualitative video responses.
inColor can be leveraged on its own, or as a supplement to quantitative research. Check out an example of inColor through quantilope's sneaker syndicated study.
Key Driver Analysis to understand motivations
A Key Driver Analysis can confirm or deny a brand’s hypothesis as to what exactly is ‘driving’ consumers’ behavior. This advanced research method works by linking outcome metrics such as customer satisfaction or purchase likelihood to ‘drivers’ of those metrics, which can often be imagery or perceptions.
Key drivers are the specific elements that have a significant impact on another variable's outcome. They’re crucial to uncover and understand, as they help businesses understand what’s working - and why, which will allow you to prioritize these drivers for your business. The drivers of each research study will depend on the research question you’re trying to answer. For example, drivers of a brand’s low customer satisfaction could be their poor customer service expensive pricing, small package value/size, or negative brand reputation in the news. Conversely, strong customer satisfaction could be the inverse of those elements (noteworthy customer service, valuable pricing, strong PR, etc.).
To put a Key Driver Analysis into a real-world context, quantilope’s client, Bakkt, used this method to understand the purchase likelihood for cryptocurrency along with barriers to the crypto market. Check out the findings from the study here or learn more about how to use quantilope’s Key Driver Analysis.
It’s important to remember that while key drivers provide valuable context to your business outcomes, they shouldn't be viewed as a direct cause-and-effect relationship. Improving a key driver might contribute to business outcomes, but there are always other elements to consider as well. It’s also important to revisit key drivers after some time to see if consumers’ opinions or perceptions have shifted - which is always possible.
Back to Table of Contents
Maximum Difference Scaling (MaxDiff) for forcing trade-off decisions
MaxDiff is one of the most popular data analysis tools for prioritizing a list of features or items. It’s an alternative to other descriptive metrics like ‘select all’ questions, ranking lists, or rating scales which can lead to a phenomenon in research where consumers will tell you that ‘everything is important’.
When respondents see a list of items, it’s common for agreement bias to kick in (i.e. they ‘strongly’ agree with most or all items, or ‘select all’ from a list). While this might be valid feedback, usually there are some items that consumers feel more strongly about than others. Further, it isn’t always helpful for your brand to receive these types of results, as it doesn't tell you where you should be focusing your energy and resources. As such, the MaxDiff forces respondents to trade off between items so they can only choose one ‘strongest’ item and one ‘weakest’ item - this might be in terms of importance (most important/least important), relevancy (most relevant/least relevant), or some other best/worst scale.
As respondents go through the MaxDiff module, they’ll see anywhere from 3+ items on a screen and are asked to pick their top/bottom choice. These elements continue to rotate between a series of screens so that respondents are comparing the same element against a different set of choices - helping brands really narrow in how important/relevant/appealing/etc... something is.
For example, let’s say a toothpaste brand wanted to know what elements of a toothpaste product are most/least important to consumers as they shop the toothpaste aisle. A MaxDiff might list a series of elements such as ‘taste’, ‘consistency’, ‘whitening power’, ‘familiarity’, ‘dentist-recommended’, ‘availability’, ‘package size’, ‘brand reputation’, and so on...
On the first screen, the respondent sees ‘taste’, ‘consistency’, and ‘whitening power’ and are forced to choose one element that’s most important to them and one that’s least. They say ‘whitening power’ is most important to them and ‘consistency’ of the toothpaste is least important. However, on the next screen of the MaxDiff, they now need to choose between ‘whitening power’, ‘familiarity’, and ‘dentist-recommended’. Here, they now say ‘whitening power’ is actually the least important and ‘dentist-recommended’ is the most. This goes to show that just because a respondent says ‘whitening power’ is important to them, you don’t necessarily know how important that element is, or if it would be a deciding factor over other elements you could instead prioritize (like including ‘dentist recommended’ on your packaging, if true).
To see a MaxDiff in action, check out quantilope’s credit card study showing the most/least influential reasons for choosing a credit card:
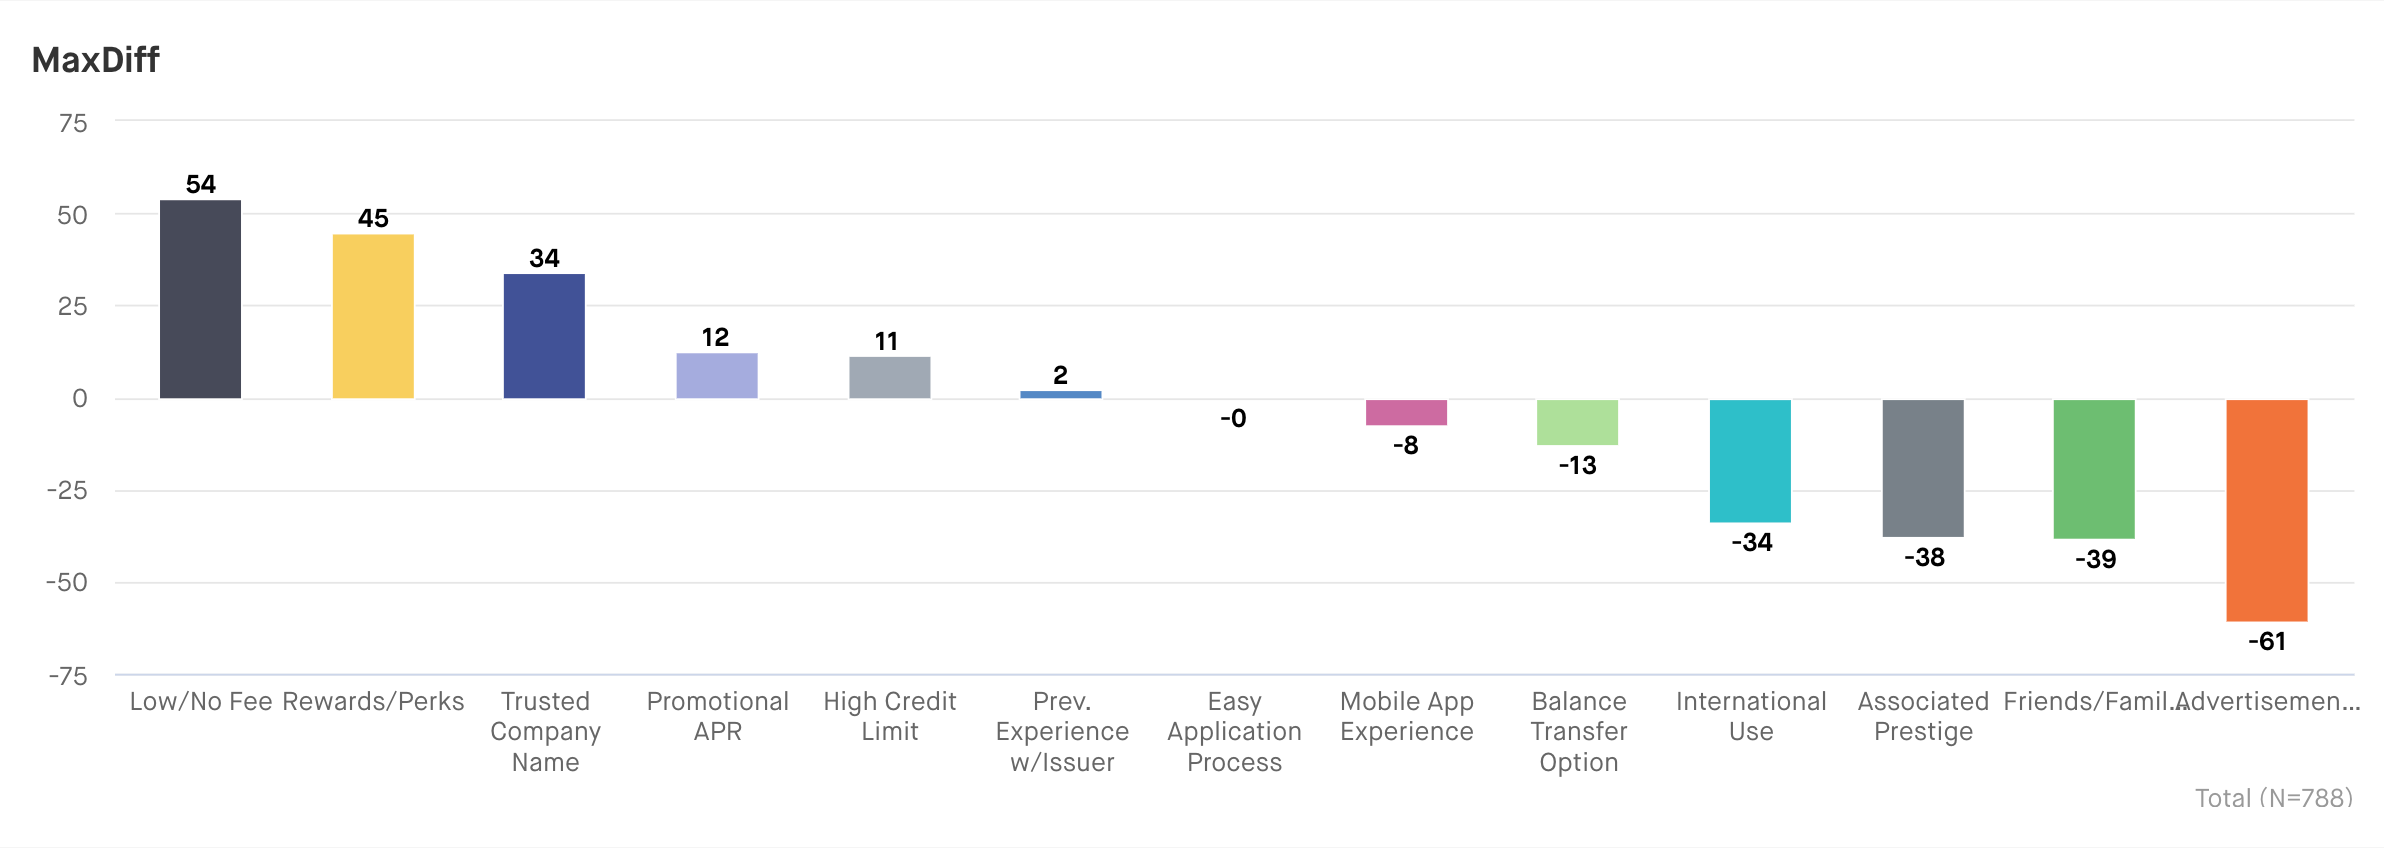 The screenshot above shows how often a feature of a credit card was chosen as 'most important' and 'least important'. Positive scores indicate a feature was chosen more often as 'most important' than as 'least important'.
Back to Table of Contents
🔗 Related: MaxDiff vs Conjoint Analysis: Which Method to Choose?
Mental Advantage analysis for understanding strengths and weaknesses
Mental Advantage analysis is a methodology for quantilope's CI tracking clients that identifies how a brand's actual association with a Category Entry Point (CEP)/brand attribute deviates from the expected association - given the brand's size and the commonality of that CEP/attribute for the category.
The analysis derives from Better Brand Health (by Jenni Romaniuk of the Ehrenberg-Bass Institute), and reveals actionable insights on which associations or attributes brands should consider prioritizing, deprioritizing, or maintaining in order to grow their market share.
While the method is commonly used in quantilope's Better Brand Health Tracking (BBHT) solution, Mental Advantage analysis can be leveraged in any tracking study that includes a multi-matrix question type (such as the example below from quantilope's Body Wash BBHT study).
Based on respondents' feedback to this type of question, Mental Advantage analysis automatically calculates key brand tracking metrics, showing which attributes perform better, worse, or on par relative to the expected score (more on that here).
The result is a highly intuitive heat map that that delivers actionable brand insights about where to grow, maintain, and defend. Cells in green show attribute/brand relationships that are stronger than expected, while red cells show where attribute/brand relationships are weaker than expected. White cells are on par with expectations.

Brands should consider incorporating Mental Advantage analysis into their trackers if they're interested in measuring the strength of their brand associations/CEPs, they want to optimize their resources by understanding which areas of their brand to prioritize, and they want to build a targeted brand strategy that will help them grow.
Back to Table of Contents
Mental Availability analysis to understand consumer mindset in buying scenarios
Mental Availability analysis is another type of advanced method available to quantilope's CI tracking clients that's used to uncover which brands come to mind for consumers in specific buying scenarios.
Like Mental Advantage analysis, Mental Availability analysis comes from Jenni Romaniuk's Better Brand Health as a science-based approach to understanding how consumers think about and shop for products. It's grounded on Category Entry Points (the particular buying scenarios that prompt consumers to think about buying from your category); the more consumers think about your brand in a variety of buying scenarios, the more likely it is your brand will grow.
Mental Availability analysis includes four key metrics:
- Mental Market Share: How present a brand is in consumers' minds with regard to all Category Entry Points (CEPs) and brands.
- Mental Penetration: How many consumers have at least some mental availability of a brand.
- Network Size: How broad/varied category associations are for each brand in your category.
- Share of Mind: What other brands customers are thinking of in addition to a specific brand (among those with MPen for the brand of interest).
These metrics gives brands a good idea of where they stand relative to competitors in their category (the major players and the smaller names). These four metrics offer unique advantages over traditional brand health tracking metrics alone (your standard awareness, consideration, usage funnel). They focus on how consumers actually make decisions in market, provide actionable takeaways, reduce bias through the use of an implicit pre-study, and one metric in particular (Mental Market Share) is highly correlated to actual sales market share.
As with Mental Advantage, this method is often used in brand tracking surveys and Better Brand Health Tracking studies, but is available to any CI tracking client that leverages a multi-matrix question. However, Mental Availability also requires the added step of running an implicit pre-study to identify relevant Category Entry Points (more on that here).
Multi Implicit Association Test for subconscious reactions to multiple brands, products, or categories
A Multi Implicit Association Test allows brands to test multiple static elements at once (be it a set of brands, products, or categories). The method is grounded in neuroscience, enabling brands to capture subconscious, implicit reactions to a set of stimuli. As a result, Multi Implicit Association Test results are free of order bias and account for the speed of reaction time.
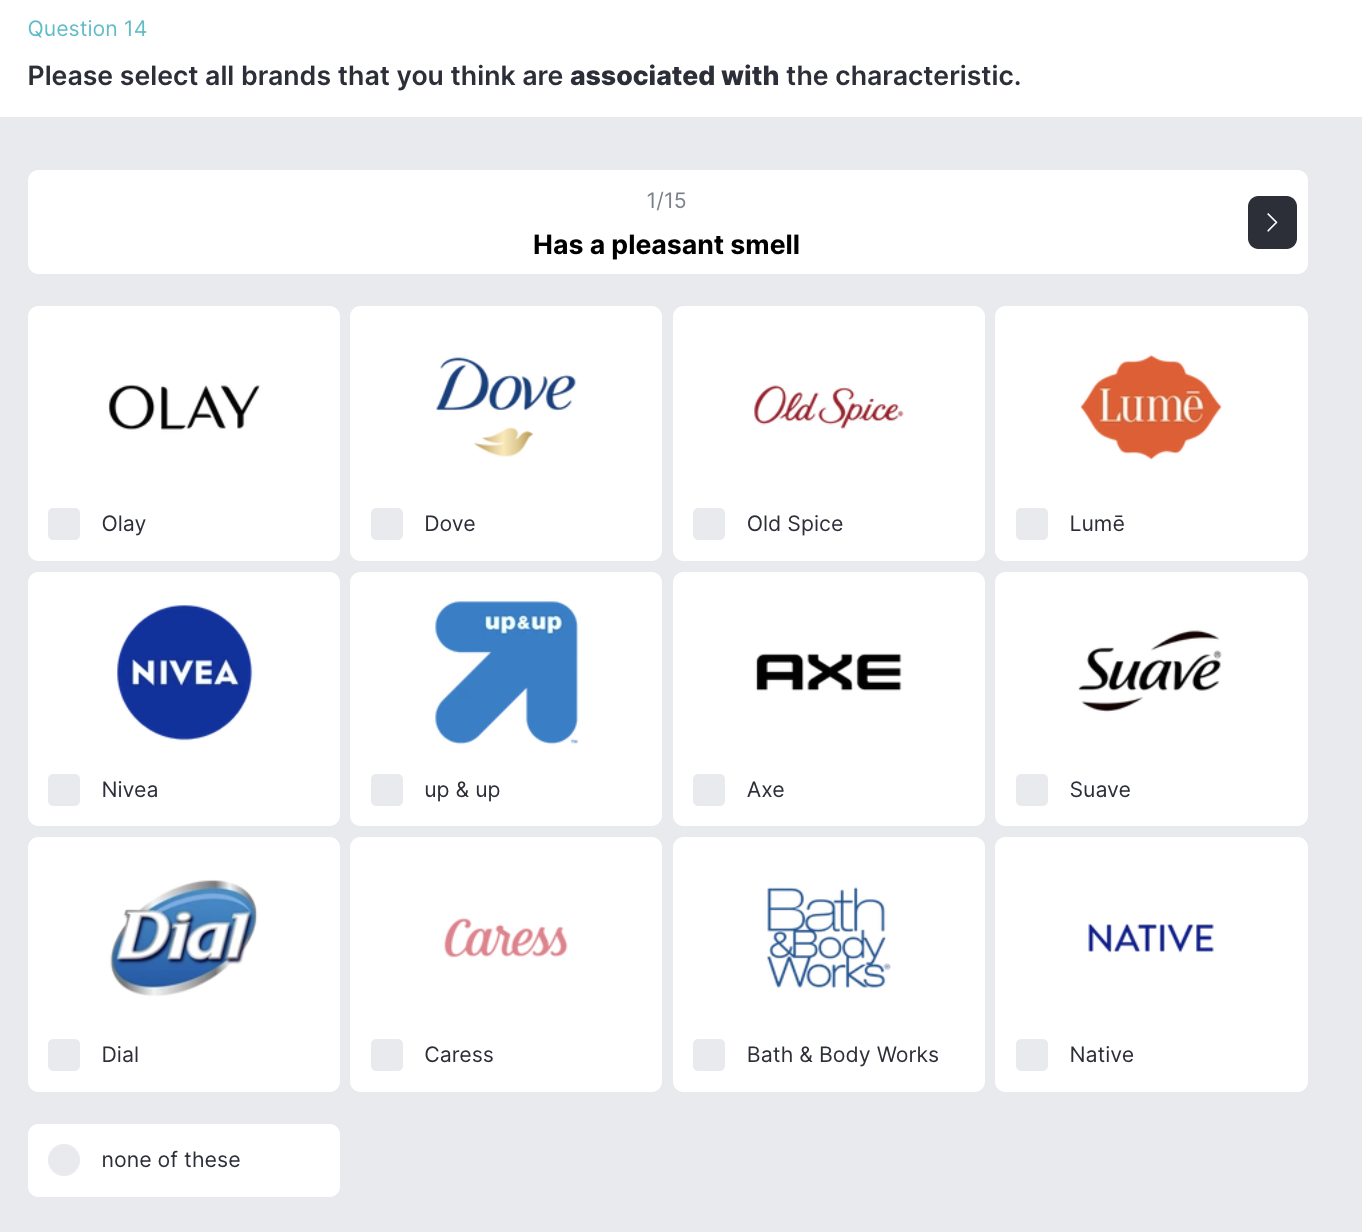
The method’s functionality works by showing respondents a list of brands (say, the top social media platforms) and asking respondents to choose which of those brands ‘fit’ with a shown dynamic association (i.e. the changing list of associations throughout the module that are shown one by one). Examples of dynamic associations could be ‘trendy’, ‘secure’, ‘fun’, ‘humorous’, ‘educational’, etc.
Below is an example of what this looks like for respondents from our Streaming and Social Platforms study.


Respondents rotate through a series of these screens, immediately choosing the platforms that 'fit' with the association shown. The faster a respondent selects an association, along with the order of associations chosen, are factored into the automatic analysis.
Multi Implicit Association Tests (and later on, you’ll learn about Single Implicit Association Tests) are one of the coolest ways to merge social sciences with research. It mimics a realistic thought process that consumers go through - choosing an answer based on their immediate gut reaction rather than spending time talking themselves in/out of an answer choice, or, choosing the answer they think would be considered 'right’.
Back to Table of Contents
Net Promoter Score (NPS) to check customer satisfaction
Net Promoter Score (NPS) is a is a key metric for measuring brand equity, tracking the likelihood that consumers will ‘promote’ or, refer, your brand to others through word-of-mouth. NPS is one of the simplest advanced methods to implement in a market research survey, yet provides powerful context into the strength of your brand.
An NPS question asks respondents to give a 1-10 response of how likely they are to recommend the brand to others. Respondents who provide a response of 6 or lower are considered your brand’s ‘detractors’; these are consumers who are unlikely to recommend or ‘promote’ your brand to others. Respondents who answer with a score of 7 or 8 are considered ‘passives’. These are respondents that may not ‘detract’ from your brand but also don’t actively promote it. Finally, you have your ‘promoters’ - those who give a 9 or 10 at your NPS question. These are the consumers who have strong, positive feelings about your brand (whether it’s related to the level of customer service, the product/service itself, or some other factor) and would recommend it to others.
Brands can use NPS anytime they’re interested in measuring their customer satisfaction levels, either in a one-off study or as part of a brand tracking study. To learn more about how this advanced research method works, check out this post on how to measure customer satisfaction.
Back to Table of Contents
Penalty-Reward Analysis (KANO Factors) to investigate relationships
Penalty-Reward Analysis (KANO Factors) is a type of advanced method that investigates the relationship between a Key Driver’s outcome and the features used within the KDA. While KDA helps brands understand what’s driving a certain outcome, a KANO Factor analysis will determine the direction and intensity that shifts of certain drivers can have on the overall outcome (be it customer satisfaction, purchase likelihood, etc.)
Because this method goes hand-in-hand with a KDA (details above), brands can use these two methods in a mixed-method questionnaire for detailed and well-rounded insights. Essentially brands can use a KANO Factor test to dive further into a KDA and explore potential actions to take (i.e. ‘this element of our product is a ‘must-have’ for purchase likelihood).
It works by categorizing data collection points from a KDA as one of three categories: ‘must-haves’ (expected qualities in order to remain competitive); ‘satisfiers’ (direct relation between this element and a positive outcome); ‘exciters’ (can have a positive impact on customers but is not a requirement or even an expectation).
This is a great method to leverage when dealing with feature prioritization, product development, or marketing strategies. Learn more about Penalty-Reward Analysis/KANO Factors here.
Back to Table of Contents
Segmentation to divide your target market into actionable groups
Segmentation is an advanced research method used to break up a large target audience into smaller, actionable groups (aka, segments).
There are several types of segmentation approaches - including demographic segmentations, behavioral segmentations, psychographic segmentations, and (quantilope’s leveraged approach) need-based segmentation.
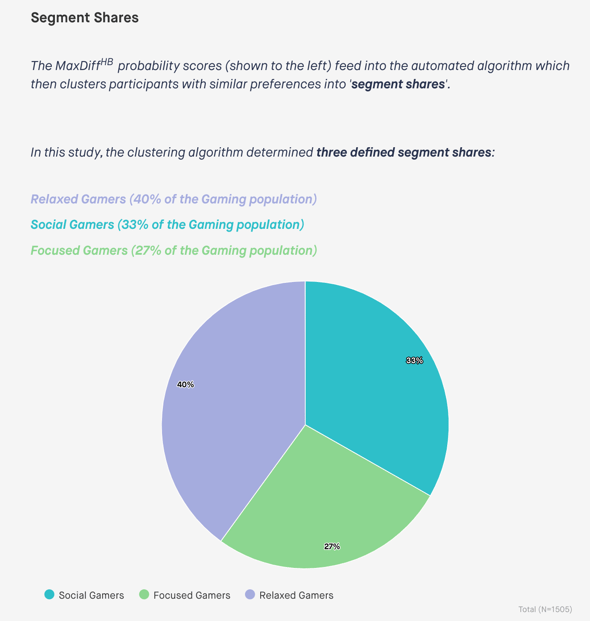
As the name implies, need-based segmentation starts by focusing on a target audience’s needs, then breaks the market into segments based on these needs. For example, quantilope’s Gaming Segmentation study asked respondents what they need out of their gaming experience - social interaction, relaxation, releasing stress/anger, improving a skillset, etc.
Because the segmentation research design starts by focusing on these needs, the segments are built around actionable findings - rather than just who gamers are demographically (for example). Other information from the survey, such as demographics, usage and attitude questions, and so on can be added as additional layers to the need-based segments, but at their core, the segments are built around consumers’ true needs.
Below is an example of what these actionable segments ended up being in our Gaming study (all segments are automatically calculated using machine-learning algorithms).
To learn more about automated segmentation with quantilope, check out this post.
Back to Table of Contents
Single Implicit Association Test for subconscious reactions to one brand, product, or category
Single Implicit Association Tests are, like the Multi Implicit Association Test, a way for brands to capture subconscious reactions to a brand, product, or category. Unlike the Multi Implicit Association Test, this method focuses on one single static element (a brand, product, or category), and rotates a series of associations that respondents can decide either ‘fits’ or ‘does not fit’ with the single element shown.
All other benefits remain the same as the Multi Implicit Association Test, such as capturing immediate gut reactions with weighted response times.
Check out the results from a Single Implicit Research Study on the sneaker category below, showing what respondents really think about popular shoe brands: Adidas, Nike, Reebok, Converse, and New Balance:
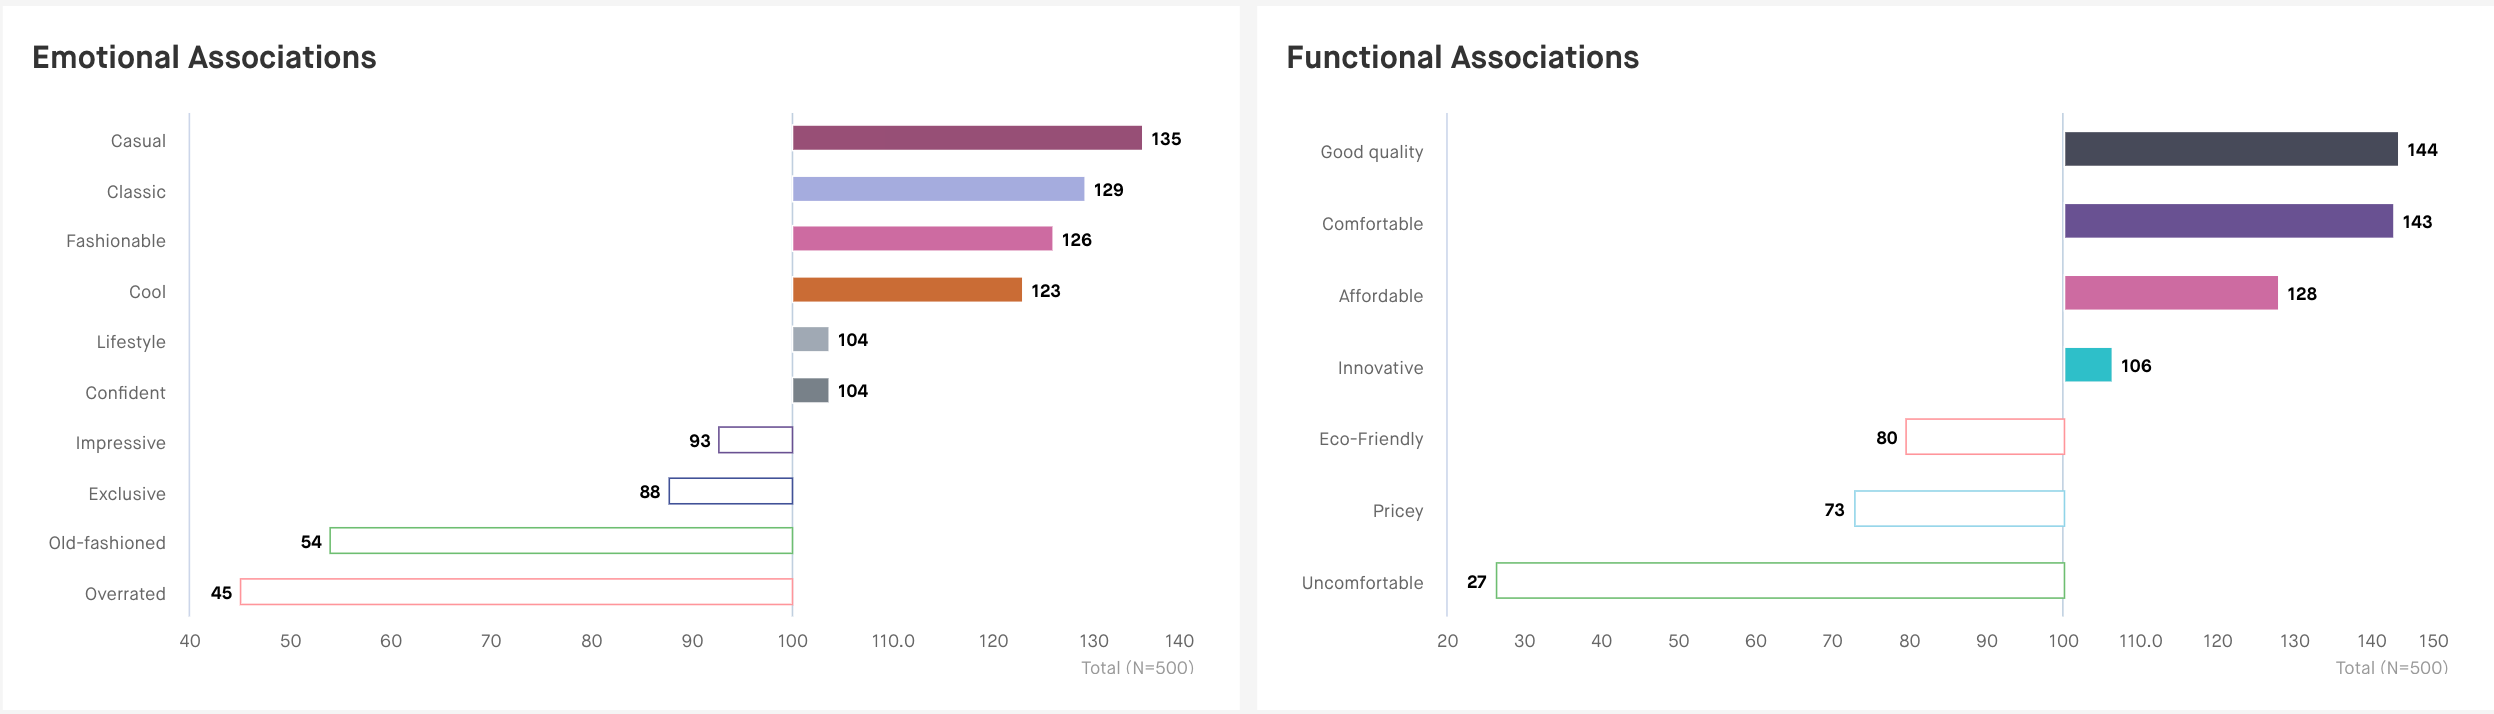 The screenshot above shows emotional and functional implicit associations for the shoe brand Adidas.
To learn more about implicit testing, check out quantilope’s Guide to Implicit Research.
Back to Table of Contents
Total Unduplicated Reach & Frequency (TURF) for the greatest consumer impact
A TURF analysis (which stands for Total Unduplicated Reach and Frequency) is a method used to optimize audience reach. This is a useful method to ensure your product offerings are ideal for reaching a wide range of consumers - rather than reaching a small group of consumers for multiple reasons.
A TURF analysis can be used to optimize messaging, decide on the best use of marketing channels, or narrow down a set of features (as just a few examples). Using a TURF, brands can understand whether or not adding something to their product or service is worth their spending by knowing how many more consumers they will reach by implementing those product/service decisions.
For example, if the decision to add a chocolate flavor to an ice cream product lineup will only reach 10% more consumers but adding a strawberry flavor will reach 30%, the ice cream brand knows where to make the best use of its budget. This could be because chocolate lovers are already satisfied with a cookies-and-cream flavor, but strawberry lovers don’t have anything similar enough to satisfy their cravings.
Check out quantilope’s skincare study which shows two different examples of using a TURF analysis - one for advertising messaging (to reach the most consumers through the use of product claims) and one for channel distribution (to reach the most consumers by advertising on the most effective mediums, such as TV, billboards, etc.).
Back to Table of Contents
Van Westendorp/Price Sensitivity Meter (PSM) for finalizing pricing
Van Westendrop, also known as a Price Sensitivity Meter (PSM), is a pricing research method that helps brands decide on the best price for their product or service. This advanced research method captures data by providing respondents with a product/service and asking them to input a numeric value for each of the following four values:
-
Price at which product/service is so expensive they would not purchase it
-
Price that’s so low they would question the product/service’s quality
-
Price that’s starting to get expensive but they would still consider buying it
-
Price they’d consider a ‘bargain’ or a great buy
Using each of these price points, quantilope’s automated analysis defines a window of prices known as the ‘Price Range’ that’s created using the upper and lower price limits and reflects what consumers consider suitable for that product/service. Within this range is the ‘Indifference’ price (equal number of consumers consider the product cheap as those who consider it expensive) and the ‘optimal’ price (an equal number of consumers consider the product ‘too cheap’ as those who consider it ‘too expensive’).
Check out what this price range graph looks like, and learn more about Van Westendorp by watching this video below:

Van Westendorp/PSM is a great method to use when introducing a brand-new product/service to the market or when considering a price change to know how price-sensitive your current consumers might be.
Back to Table of Contents
Advanced method research with quantilope
When it comes to advanced research methods, no other brand tracking software offers as many as quantilope’s Consumer Intelligence Platform. With 15 to choose from, quantilope is your one-stop-shop for all advanced research needs.
quantilope's advanced methodologies are fully automated, meaning you can unlock insights that offer clear recommendations in just a few days versus weeks or months using traditional research agencies.
The platform offers a range of consultation services, from fully-managed projects, to ‘Do-It-Together’ and ‘Do-It-Yourself’, depending on your needs. Regardless of your choice, all methods are fully automated and available from a pre-programmed drop-down menu. Simply customize to reflect your own brand’s needs, and start collecting advanced method data in real time.
Ready to get started with an advanced method on quantilope's Consumer Intelligence Platform? Get in touch below!